In one minute In our study, each contributor to an agent-era project added over three times as much new code a week as contributors to pre-agent projects of the same age: 3.3 times at six months.1 All of that code lands on the same reviewers. Good teams point their review time at the code that history says breaks, run the tests a change actually reaches, and keep each change small enough to read.
The reviewer is the fixed resource
An example. A 900-line pull request lands at 11am. Two people know that part of the code, and both are in planning until 4pm. Three more pull requests of the same size are already waiting.
Coding agents made writing code cheap. Reading it costs what it always did. Every change that merges still needs a person who understands what it does and what it might break, and that person has the same number of hours this year as last.
So the queue grows. Reviews get shallower or slower, often both, and neither shows up on a dashboard until something breaks in production.
What the data shows
In our study of 200+ popular open-source repositories, we compared agent-era projects, started in 2025 or later, with pre-agent projects, started between 2021 and mid-2024. To keep it fair, we measured both at the same age: 180 days old, and again at their 1,000th commit.
At 180 days, a typical agent-era repo saw 1,365 new lines per contributor per week. A typical pre-agent repo at the same age saw 415, so each person added about 3.3 times as much code.1
By the 1,000th commit the gap had widened to about 4.7 times.1 The number of commits per person rose only a little, so each commit carries more code.
We measured lines added, not review minutes, and some of those lines are scaffolding a reviewer can skim. Every added line still reaches the review queue. The appendix has a command for a rough version of this ratio on your own repository.
Industry telemetry points the same way. Faros AI found that on teams with high AI adoption, the average pull request grew 154% and review time per pull request rose 91%.2 That is vendor data with a different method from ours. The direction matches: more code arrives, and the line in front of reviewers gets longer.
Figure 4.1

Send attention where breakage lives
If nobody can read every line with the same care, decide which lines get the careful read. Bugs are not spread evenly. They come back to the same places, and git history already records where those places are.
Check four signals before anyone opens the diff:
- Hotspots, files that change often and are already hard to read. A change there lands on code many people touch.
- Files with a bug fix in the last 90 days. Code that needed a fix recently has shown it is easy to get wrong.
- Files that usually change together but do not import each other. History says they move as a pair even though the code never links them, so a pull request that edits one and skips the other is the classic forgotten change.
- Size. A change much larger than your usual one deserves a second look.
Put these together and you get a risk ranking. Use it to order the queue, the way a hospital uses triage. A high rank means a person should look first, and the usual result is a split or a second reviewer. A low rank means "later", not "safe". A two-line edit to payment retry logic can matter more than a 2,000-line generated client, which is why the fix history of each file sits next to the size of the change.
Routing matters as much as ranking. Send the top of the queue to the person who last fixed those files, or who knows them best, and let one approval stand for the rest. Second reviewers then go only where history says they pay off.
Run the tests the change reaches
A full test suite on every change gets slow. Slow suites get skipped, or rerun until they pass.
A better pattern is to run the tests that reach the changed code first, then the full suite at merge. There are two ways to know which tests those are. A test coverage report, run with per-test tracking turned on, records which test actually ran which lines, so its answer is measured. Your import and call graph shows which tests can reach a file, so its answer is inferred. Keep the label on each answer, and never blend the two into one percentage.
Inferred links show which tests can reach a file. Measured test coverage shows which ones ran its lines. A test that imports a module can still skip the line you changed, so treat an inferred link as a candidate and a measured one as proof. Measured test coverage goes stale as the code moves, so refresh it on a schedule. Weekly suits most teams.
Then check the quick set against reality. Once a month, count how often the full suite caught a failure the quick set missed. If that count stays near zero, you have earned the faster loop.
Keep changes small enough to read
An agent will happily produce a 2,000-line pull request in one sitting. A reviewer cannot read it in one. The answer is a size budget that applies to agents and people alike.
Take your last 100 merged pull requests and find your median size and your 95th percentile, the size that only 1 in 20 exceeds. Anything above that line gets split or gets a second reviewer. If two groups of files in one change share no imports and never change together, they are two changes.
Write the budget into the instructions your agents read, next to your coding conventions. An agent follows a written rule on every run. A reviewer who asks for a split after the fact spends the hour you were trying to save. Of all the controls in this chapter, a size rule is the cheapest to run.
Do this on Monday
- Measure the median and 95th-percentile size of your last 100 merged pull requests, in lines changed (command in the appendix).
- Rank the files touched by fix commits in the last 90 days:
git log --since="90 days ago" --no-merges -i --grep=fix --format= --name-only | grep -v '^$' | sort | uniq -c | sort -rn | head -20. The appendix has a sharper version. - Require a second reviewer only on pull requests that touch a file near the top of that list.
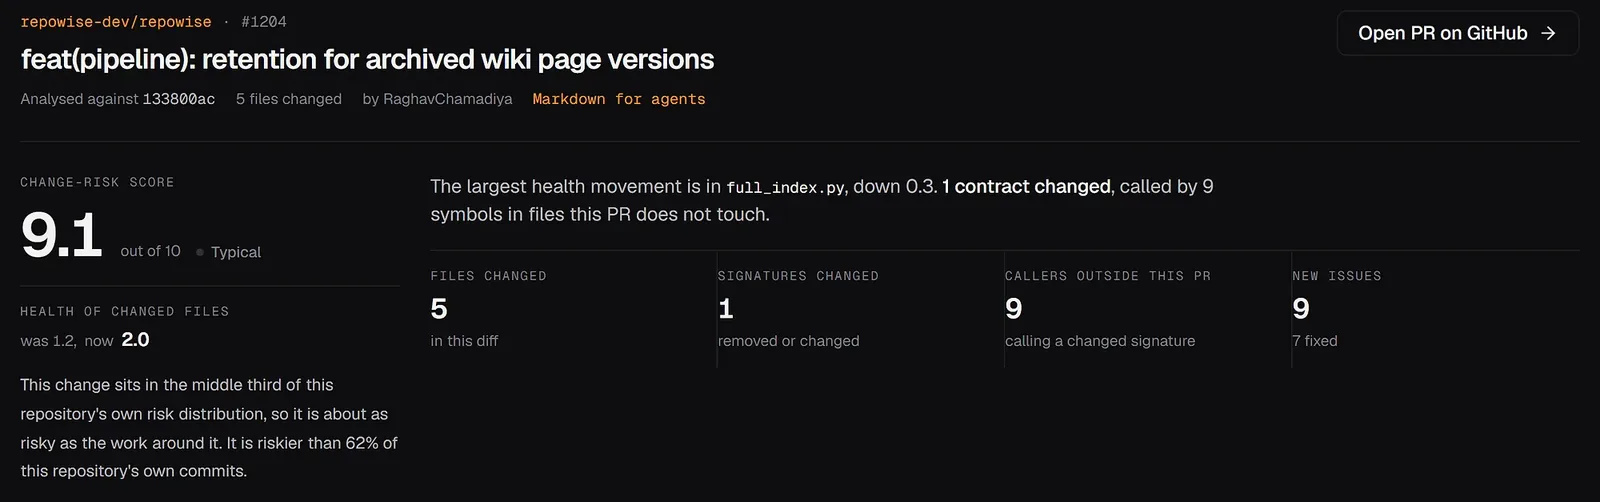
How Repowise does this Repowise ranks each change against your repository's own recent history. The output is one change-risk report per pull request: the bug-fix record of every file it touches, the files that usually change with it but were left out, and the tests that reach the diff, each marked measured or inferred.
Sources
Footnotes
-
Repowise study of 200+ open-source repositories, 2026 (method and cohort table: appendix). 131 agent-era projects (started 2025 or later) and 80 pre-agent projects (started 2021 to mid-2024), matched by age: 126 vs 72 projects with data at 180 days, 99 vs 77 at the 1,000th commit. Median lines added to .py, .ts and .tsx files (tests and vendored code excluded) per active contributor per week; bots and agent accounts excluded, agent-assisted commits credited to the human author. 1,365 vs 415 at 180 days and 1,807 vs 388 at the 1,000th commit; two-sided Mann-Whitney p = 5e-12 and 7e-15. Lines added, not review minutes. Observational. ↩ ↩2 ↩3
-
The AI Productivity Paradox, Faros AI. 1,255 teams and 10,000+ developers, telemetry through June 2025. https://www.faros.ai/blog/ai-software-engineering. Vendor telemetry, correlational. ↩