On this page
- What "good enough" looks like after four hours
- Why the lens changes with the reason you opened the repo
- The four lenses
- Surface: what is this thing?
- Shape: how is it organized?
- Risk: what will hurt to touch?
- Health: what is rotting?
- The four-hour workflow
- The memo template
- Red flags and green flags
- When to narrow the scope
- Doing the pass with an AI agent
- A minimal checklist
- FAQ
To read a codebase you didn't write, skip the file tree and read by lens: Surface (what it is), Shape (how it is organized), Risk (what hurts to change) and Health (what is rotting). Four hours is enough to produce a defensible map and a one-page memo. The goal is not mastery. It is knowing where control enters, which modules carry the weight, and which files you should not touch casually.
This method is one part of how to onboard engineers faster on any codebase.
What "good enough" looks like after four hours
A first pass is done when you can answer six questions without guessing.
- What is the product boundary: library, service, CLI, worker or monorepo?
- Where does control enter the system?
- What are the main modules or services?
- Which parts are risky to change?
- Which parts are already unhealthy?
- What should I verify before I ship a change?
The output is three artifacts: a one-page architecture summary, a ranked risk list and a short list of questions for whoever owns the code. That is enough to start work. It is not enough to sign off on a rewrite or a migration, which needs runtime data and more history.
Why the lens changes with the reason you opened the repo
The same four lenses apply everywhere, but the weight shifts by situation.
| Situation | What you need most | Lens to lean on |
|---|---|---|
| Joining a team | Module boundaries and conventions | Shape |
| Technical due diligence | Debt, ownership concentration, test gaps | Risk and Health |
| Consulting engagement | Highest-risk modules in the first hour | Risk |
| Evaluating an open-source dependency | Bus factor, circular dependencies, activity | Health |
Scroll the table sideways to see every column.
For the due diligence case in depth, see the code audit checklist for technical due diligence.
The four lenses
| Lens | Question | Output |
|---|---|---|
| Surface | What is this thing? | Product summary, entry points, runtime model |
| Shape | How is it organized? | Module map, dependency edges, boundaries |
| Risk | What will hurt to touch? | Hotspots, owners, co-change, dependents |
| Health | What is rotting? | Dead code, test gaps, stale docs |
Scroll the table sideways to see every column.
Read them in that order. Each lens narrows what the next one needs to examine.
Surface: what is this thing?
Read five things first: the README, the primary build file, the deployment manifests, one entry point, and any generated architecture docs. That is README.md, pyproject.toml or package.json or go.mod, a Dockerfile or compose file, and something like main.py, src/index.ts or cmd/server/main.go.
Answer four questions: is it a library, service, CLI, worker or plugin; what is the runtime; which external systems does it touch; what is the happy path. Write one sentence: "This repo is a ___ that does ___ for ___." If you cannot, keep reading the root files until you can.
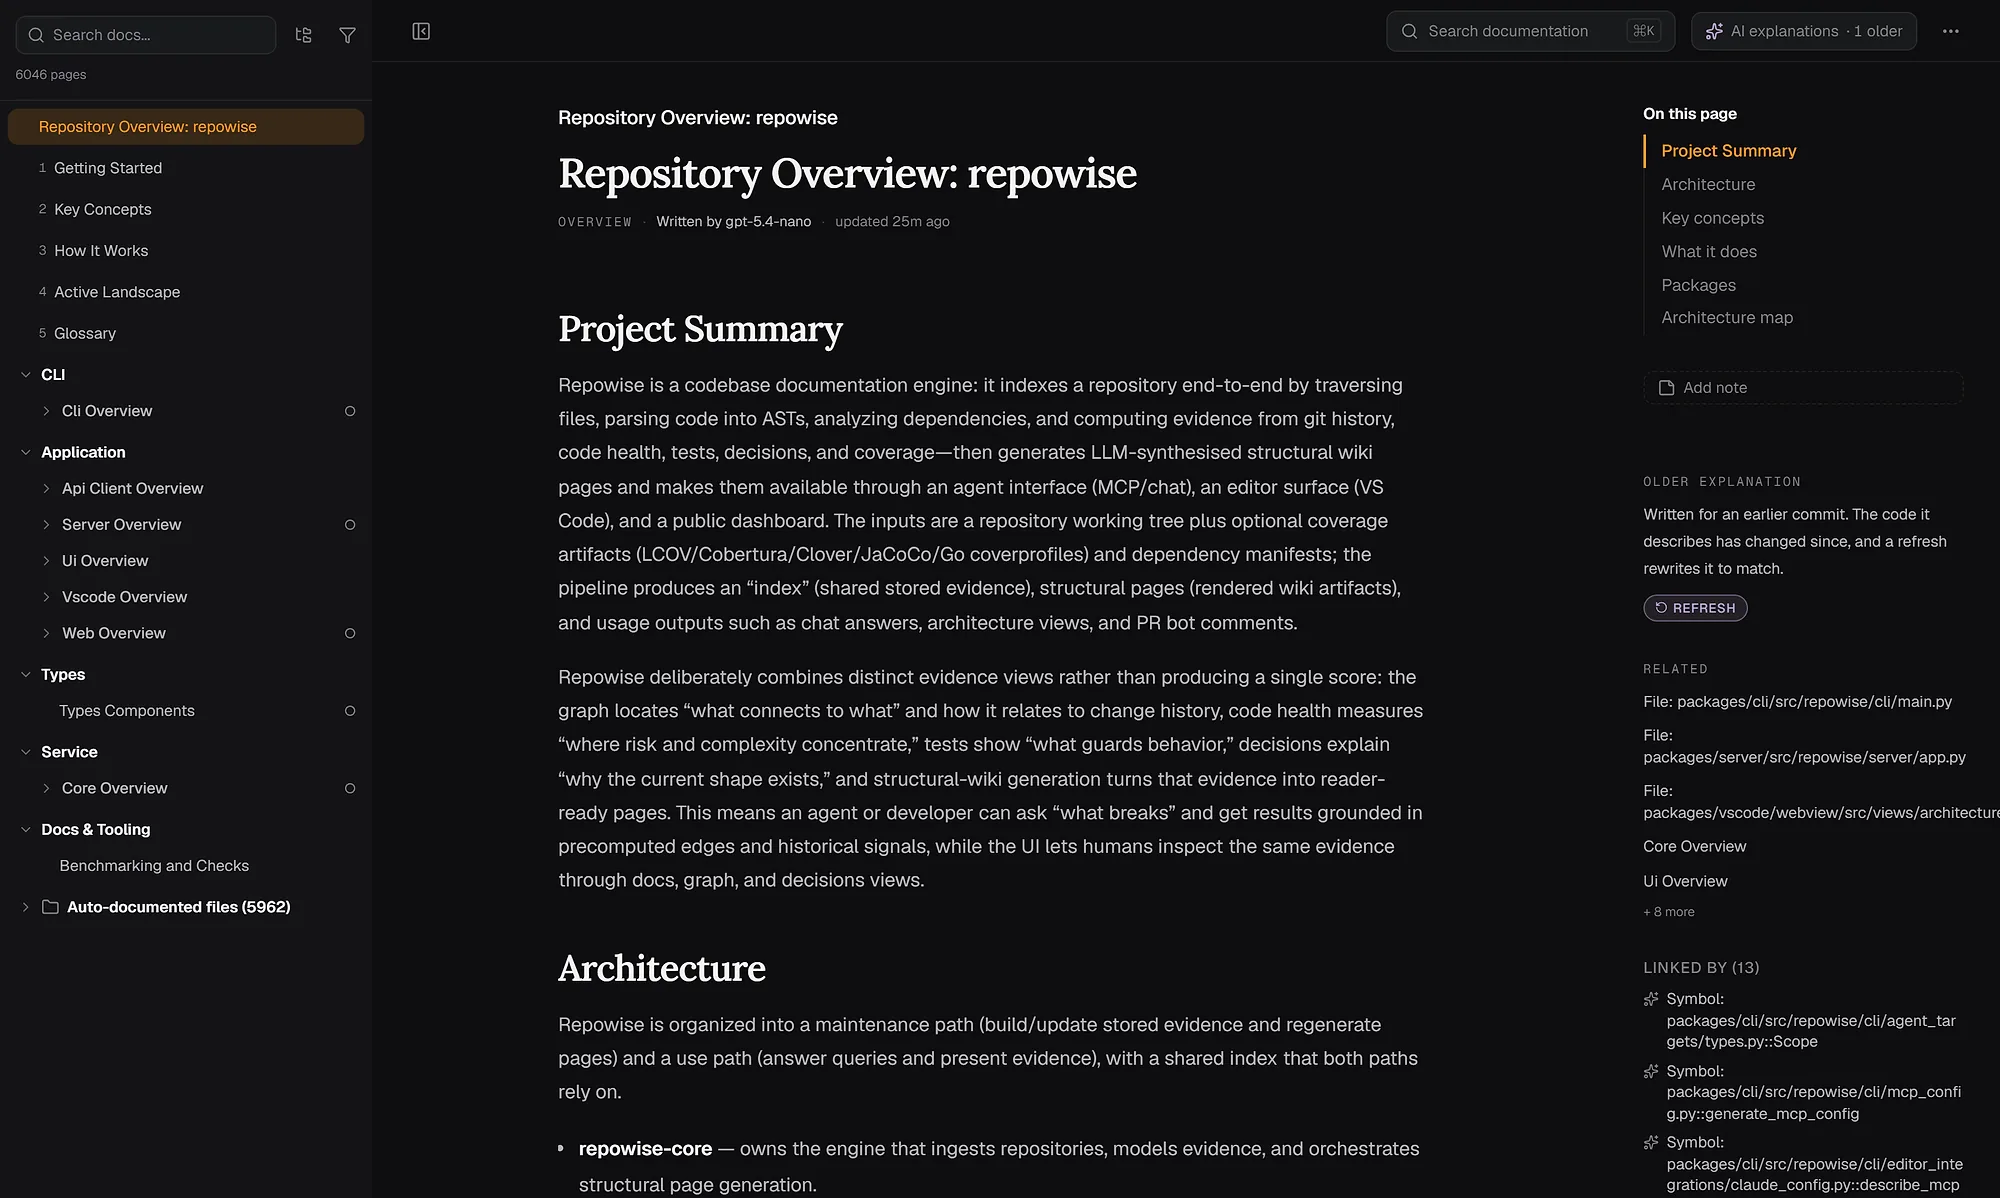
With repowise indexed, the same pass is one call. get_overview returns the summary, key modules, entry points, layers, code and git health, and next actions, and is designed to be called once, first, in an unfamiliar repo.
Shape: how is it organized?
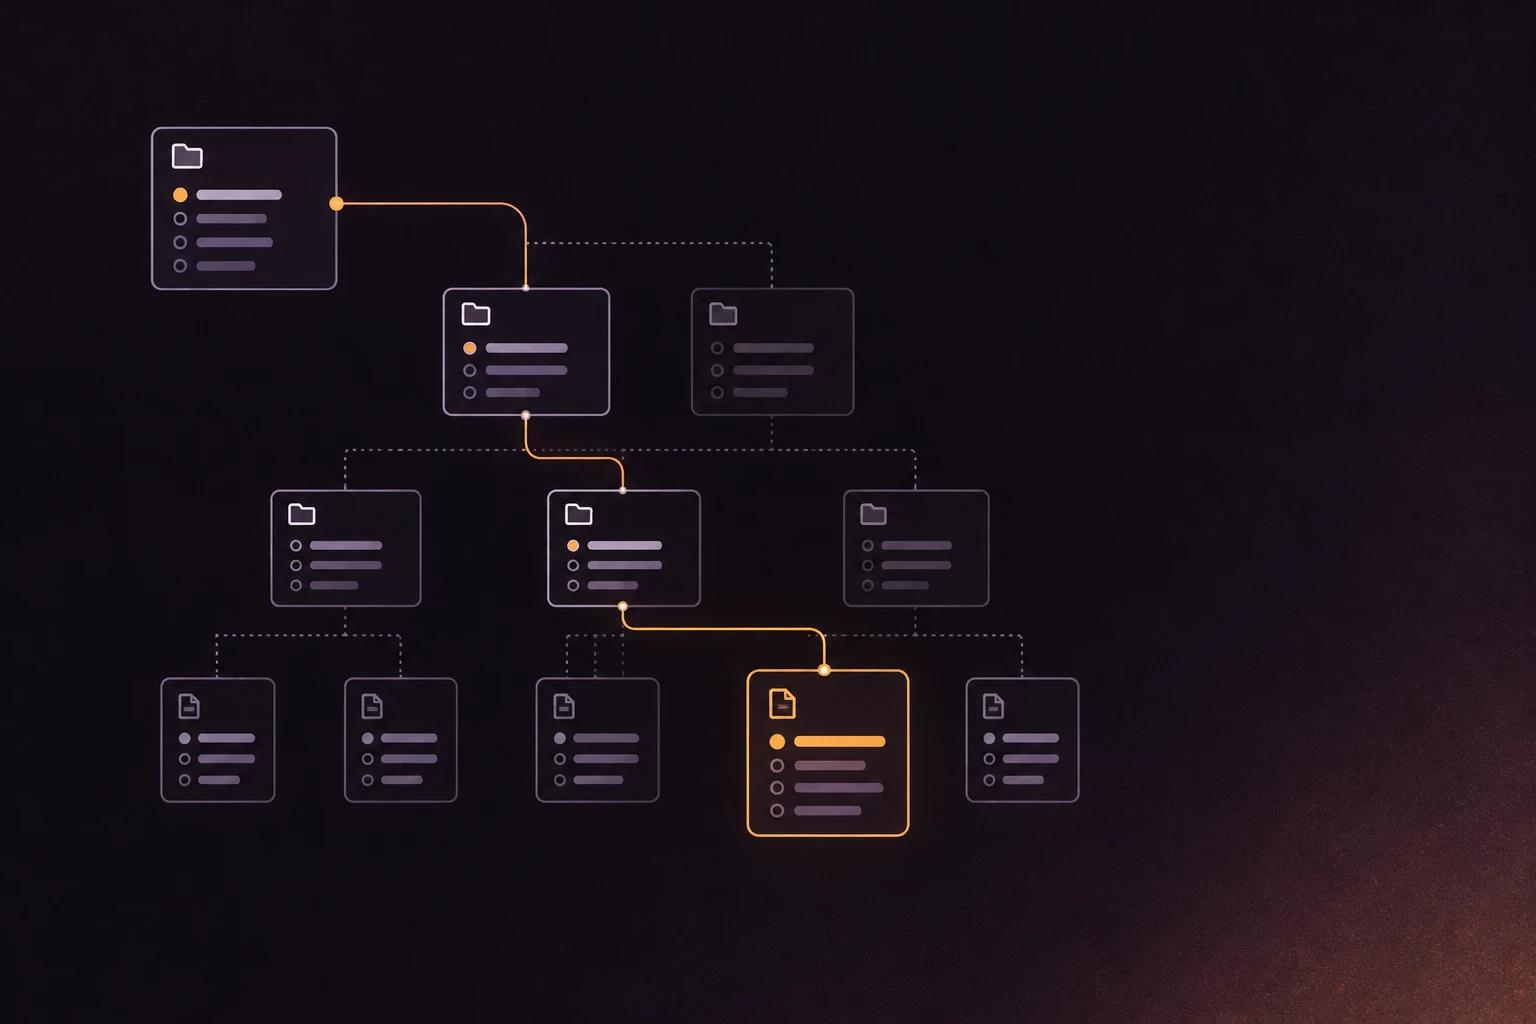
Chase boundaries, not folders. In most systems a small share of files explains most of the behavior, so find that spine: top-level packages, shared libraries, adapters to databases and third-party APIs, and the domain modules between them.
- List the top-level directories.
- Find the entry points and bootstrap code.
- Follow imports from the entry point into the core.
- Note where business logic lives and mark infrastructure edges separately.
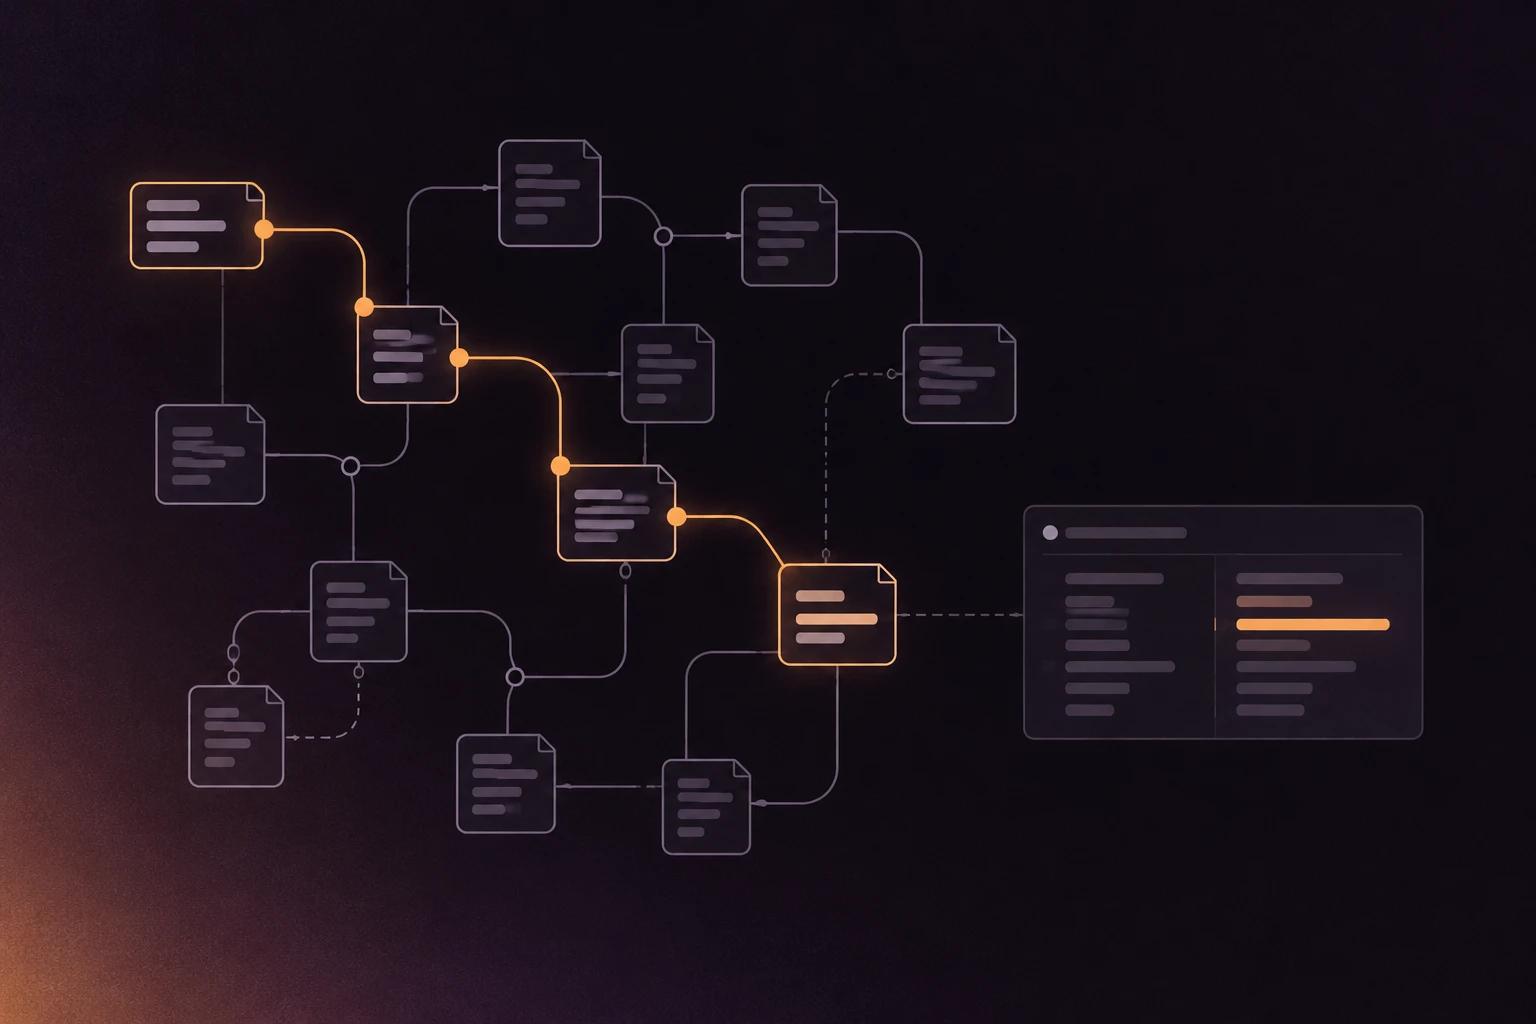
The shape of the dependency graph tells a story. Edges flowing one way mean clear layering. Cycles, where A imports B and B imports A, point to a missing abstraction. A module imported by most of the codebase is a concentration of risk, especially with thin tests. repowise builds this graph with import and call resolution across 28 languages and groups files into communities so the spine is visible at once. Browse a real one in the FastAPI architecture graph.
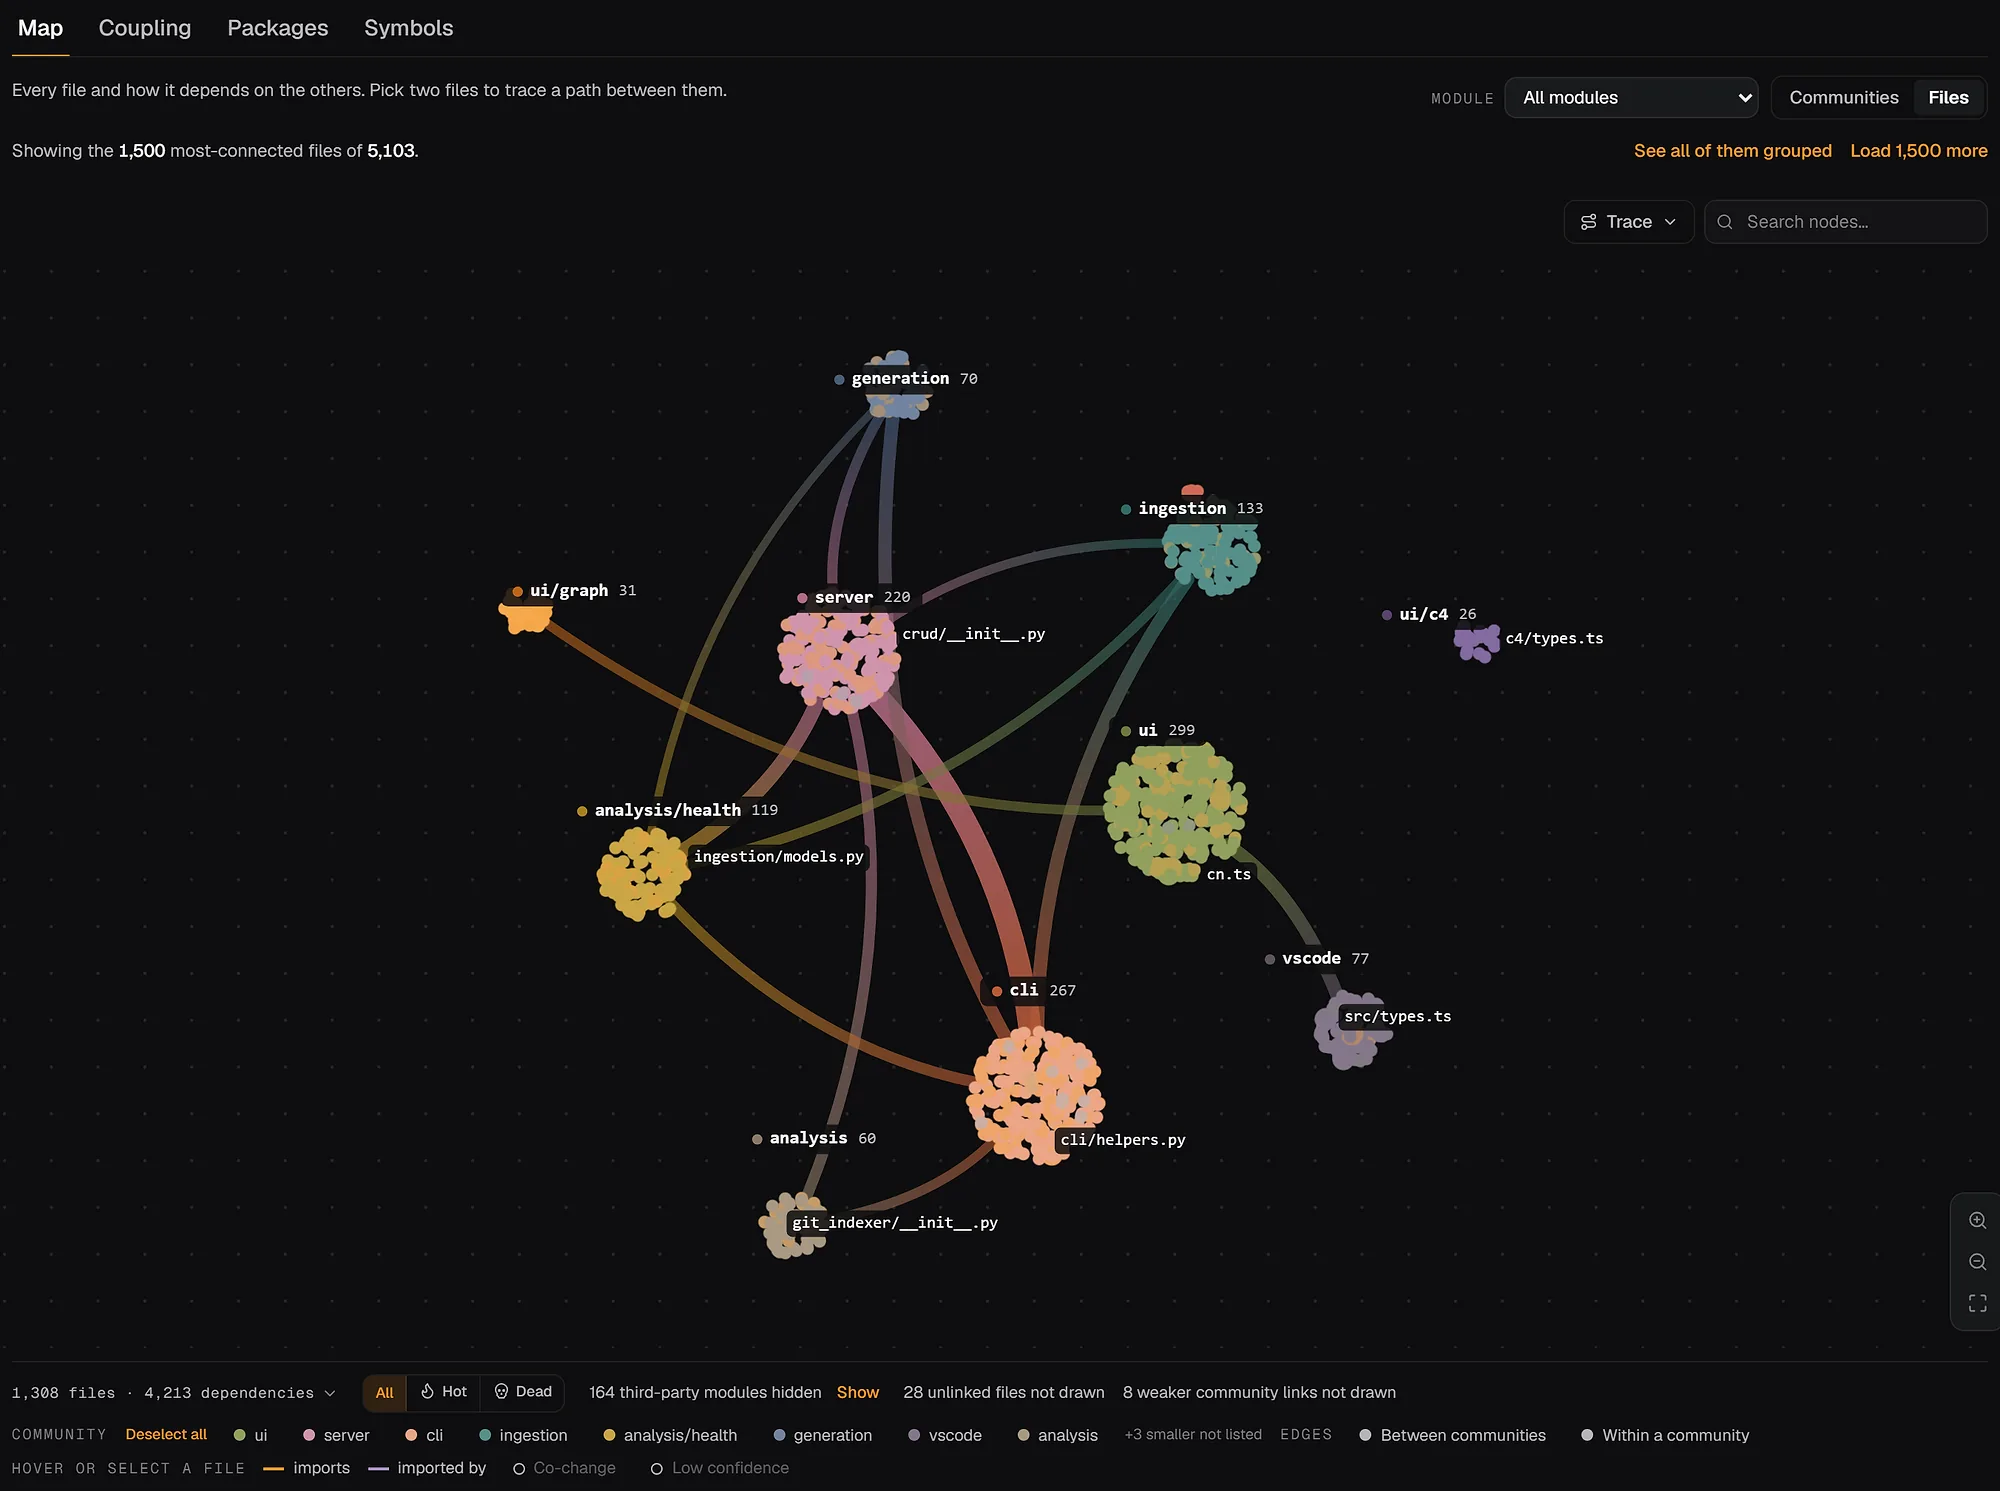
When two distant files need connecting, repowise serve lets you pick two files in the graph and trace the path between them.
Risk: what will hurt to touch?
Risk is not size. It is churn, complexity, dependents and repeated co-change together. A small file that changes weekly, sits on the critical path and moves with many unrelated files deserves more attention than a large file nobody touches. CodeScene defines a hotspot the same way: complicated code that you have to work with often, found by combining a complexity proxy with change frequency mined from version control.
You can approximate this with plain git:
# most-changed files in the last 6 months
git log --since="6 months ago" --name-only --pretty=format: | sort | uniq -c | sort -rn | head -20
repowise adds bug-fix history, dependents and ownership to the same signal. get_risk returns hotspot score, bug-fix record, owners, co-change partners and dependents for any file, and repowise context <files> prints the same triage card in the terminal.
repowise risk --target src/auth/session.py # owner, recent owner, bus factor
A good risk note reads like this:
payments/ledger.py: high churn, many dependents, test coverage unknownauth/middleware.ts: central path, hard to mock, likely production impactmigrations/: rarely changed, large blast radius, check the deploy process
Health: what is rotting?
Health is what saves time later, so check it before you start changing things. Look for dead files and unused exports, hotspots with no tests, circular dependencies, large packages with no clear owner, and docs that disagree with the code.
Two social signals matter as much as the code. Bus factor counts how many people it takes to cover most of a file's history. repowise reports it per file, where 1 means one author wrote at least 80% of the commits. Doc freshness compares a doc's last edit to the code it describes: if the code moved fifty times since, the doc is a liability.
repowise health      # KPIs and lowest-scoring files
repowise dead-code   # unreachable files and unused exports, by confidence tier
repowise doc-drift   # documentation the code no longer supports
The same data is available to an agent through get_health and get_dead_code. See the code health feature for how scores are built.
The four-hour workflow
If you only have thirty minutes, run the same four phases at five to ten minutes each and lean on generated overviews.
| Hour | Phase | Do | Write down |
|---|---|---|---|
| 1 | Orient | Read README, build file, entry point; note external services | The one-sentence summary |
| 2 | Map the spine | Follow imports into the core; trace the request or job path; mark validation, side effects and error handling | Top five internal modules, critical paths |
| 3 | Rank risk | Review git history, dependents and co-change; look for low-test, high-churn overlaps | One or two "do not touch casually" areas |
| 4 | Health and memo | List dead code, duplication, test and doc gaps, trends | The memo, plus open questions |
Scroll the table sideways to see every column.
End hour four by writing, not reading. The memo should fit in a PR description or a ticket comment.
The memo template
Vague notes are worthless, so use a fixed template.
- System summary: "A Python API service that ingests events, normalizes them and writes results to Postgres and S3."
- Entry points: exact files and commands (
src/main.py,make dev,uvicorn app:app). - Critical paths: the three flows that matter most, such as validation, persistence and notification dispatch.
- Risk list: ranked by probable blast radius, not by gut feel.
- Health list: rot, not style: no tests under
billing/, dead exports inshared/, a cycle betweenapi/anddomain/. - Questions for the owner: which module is safest to change first, which path has the most incidents, what is intentionally untested, which directories are stale.
The last item is the most valuable. A good question to a person is worth an hour of reading.
Red flags and green flags
| Red flag | What it usually means |
|---|---|
| Circular dependencies | A missing abstraction |
| High churn in complex files | A recurring source of bugs |
| Docs far behind the code | Maintenance has lapsed |
| One contributor wrote the core | Knowledge loss risk |
Scroll the table sideways to see every column.
| Green flag | What it usually means |
|---|---|
| Heavily reused utility modules | Shared logic is centralized |
| Little dead code | The team prunes regularly |
| Consistent conventions | Engineering discipline |
| Fresh, generated docs | Visibility is maintained deliberately |
Scroll the table sideways to see every column.
When to narrow the scope
Switch from a full audit to targeted investigation when the repo is too large to map in an afternoon. Signs: too many services, an entry point that fans out into several subsystems at once, no tests and no docs, business logic that depends on systems you cannot run, or mostly generated or vendored code.
In those cases write a partial memo and ask for the missing artifact: logs, an architecture doc, an ownership list or staging access. If you can name the top three risk zones and the top three health issues, proceed. If not, narrow scope.
Doing the pass with an AI agent
An agent can run the same four lenses if it can query the repo instead of grepping it. repowise serves ten tools over the Model Context Protocol, the open standard for connecting AI applications to external systems. The default tools map to the lenses:
| Lens | Tool | Returns |
|---|---|---|
| Surface | get_overview | Summary, key modules, entry points, layers, health |
| Shape | get_context, search_codebase | File and symbol cards, dependents, matches |
| Risk | get_risk, get_change_risk | Hotspots, owners, co-change, blast radius |
| Health | get_health, get_dead_code | Scores, findings, unreachable code |
| Why | get_why, get_answer | Decisions, history, cited answers |
Scroll the table sideways to see every column.
Start with repowise init --yes --no-prose: it builds the graph, git analysis, health and dead-code layers with no API key. Then repowise serve runs the dashboard and the MCP server. See the live examples to compare the outputs against a real repository.
A minimal checklist
- Identify the entry point.
- Read the README and build files.
- Map the module spine.
- Trace the happy path.
- Inspect history for churn.
- Rank hotspots by impact.
- Find dead code.
- Note test gaps.
- Write the open questions.
- Decide whether the repo is safe to change.
FAQ
- How do I read a codebase I didn't write without reading every file?
- Start at the entry point, follow imports into the core, then inspect git history for the files that change most. You want the shape of the system, not a catalog of every file. A dependency graph and generated docs cut the search space sharply.
- What is the fastest way to explore a new codebase?
- Read the README, the build file and one entry point, then follow the hottest path through the code rather than the alphabet. For a large repo, an indexed overview such as repowise
get_overviewgives you the modules, entry points and health in one call. - How do I know which files are risky?
- Combine churn, complexity, dependents and co-change. A file that changes often and sits on a central path is riskier than a large file that rarely moves. Hotspot analysis, including CodeScene's, is built on that idea.
- What belongs in a legacy code review checklist?
- Entry points, runtime dependencies, churn, hotspots, dead code, test gaps and ownership. The checklist should show where change is dangerous, not just where code exists.
- What is bus factor and why check it?
- Bus factor is how many people it takes to cover most of a file's commit history. A bus factor of 1 on a critical file means one person holds the knowledge, which is a risk if they leave.
- When should I stop and ask for help?
- When you cannot explain the system in one sentence, the entry point is unclear, or the blast radius is too large for one afternoon. Ask for architecture notes, test fixtures or ownership data before digging further.
- Can MCP help with codebase audits?
- Yes. MCP is a standard way for AI clients to call external tools, so an agent can query the dependency graph, risk and health data directly instead of reading files one by one.