On this page
- Two ways to put a number on technical debt
- SonarQube Server: debt ratio and maintainability rating
- CodeScene: code health and hotspots
- Qlty, formerly Code Climate Quality
- Codacy
- NDepend
- repowise
- Does a technical debt score predict bugs?
- Which technical debt tool should you use?
- Try it on your own repository
- How we measured
- FAQ
Technical debt measurement tools fall into two groups. SonarQube Server, Qlty (formerly Code Climate Quality), Codacy and NDepend count rule violations, estimate fix time and report a debt ratio or letter grade. CodeScene and repowise score each file from 1 to 10 and add git history, and they are the two that publish evidence the score points at files that later get bug fixes. Use the first group to size cleanup and gate new code, and the second to decide where to spend it.
As of October 2026:
| Tool | What it counts | Score you see | Reads git history? | Published evidence the score points at bugs |
|---|---|---|---|---|
| SonarQube Server | Rule violations; debt is minutes to fix maintainability issues | Debt ratio = debt / (30 min x lines of code); rating A to E (A is 5% or less) | Only to scope "new code" | None from the vendor; two academic studies of Java rules (Lenarduzzi et al.) found weak links to faults |
| CodeScene | 25+ code factors, plus change frequency for hotspots | Code Health 1 to 10 per file; hotspot health | Yes | Code Red paper (2022): 39 proprietary codebases, 15x more defects in low-quality code |
| Qlty (formerly Code Climate Quality) | Duplication and structure smells, cognitive and cyclomatic complexity, coverage | Debt ratio against a COCOMO estimate; grade A to F | No | None cited on the pages we checked |
| Codacy | Issues, cyclomatic complexity, duplication, coverage | Grade A to F, a weighted average of those four | No | None cited on the pages we checked |
| NDepend (.NET) | Rule issues, each with debt and annual "interest" in man-time | Debt ratio and SQALE rating A to E; breaking point per issue | Compares against a baseline | None cited on the pages we checked |
| repowise | 25 deterministic defect markers, several read from git history (churn, author count, change entropy) | Health 1 to 10 per file, in three signals: defect risk, maintainability, performance | Yes | Open study: 21 repos, 9 languages, ROC AUC 0.74 |
Scroll the table sideways to see every column.
We build repowise, so weigh our entry accordingly. The measurements we publish about it, with their methods, are on the benchmarks page.
Two ways to put a number on technical debt
A debt ratio is a cost model, and a health score is a risk model. They answer different questions, and most confusion about "which tool is right" comes from reading one as the other.
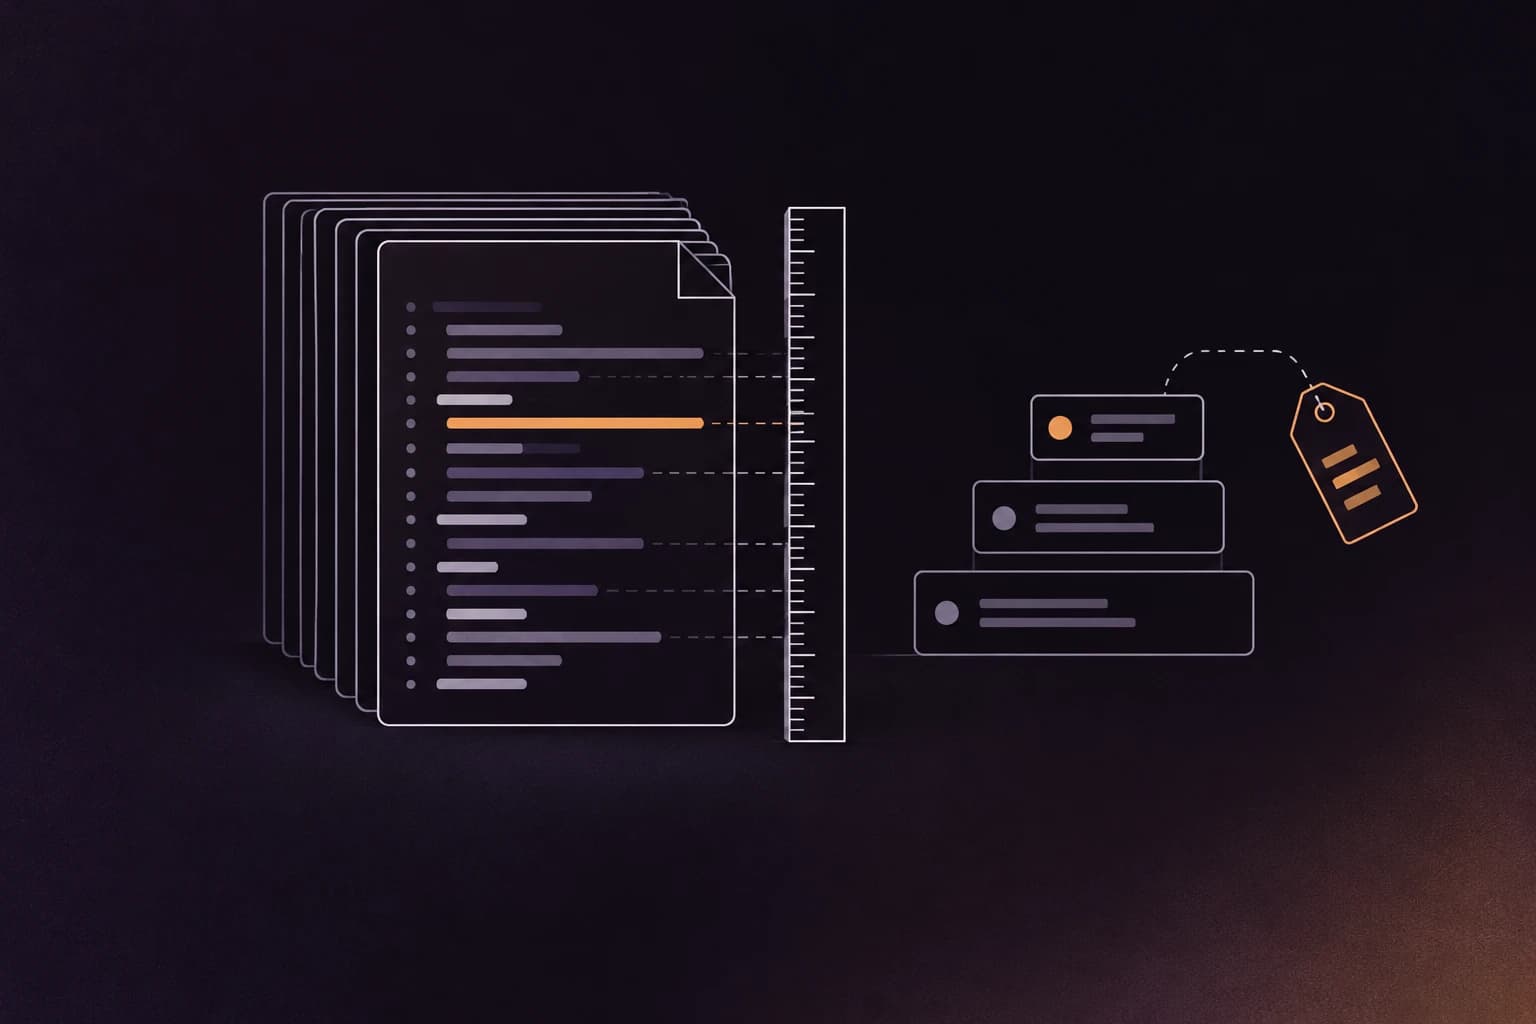
Most tools in the first group descend from the SQALE method: give every rule violation a time-to-fix, add them up, and divide by an estimate of how long the code took to write. The result is a ratio with a letter grade on top. It answers "how much cleanup is in here, relative to the size of the code?"
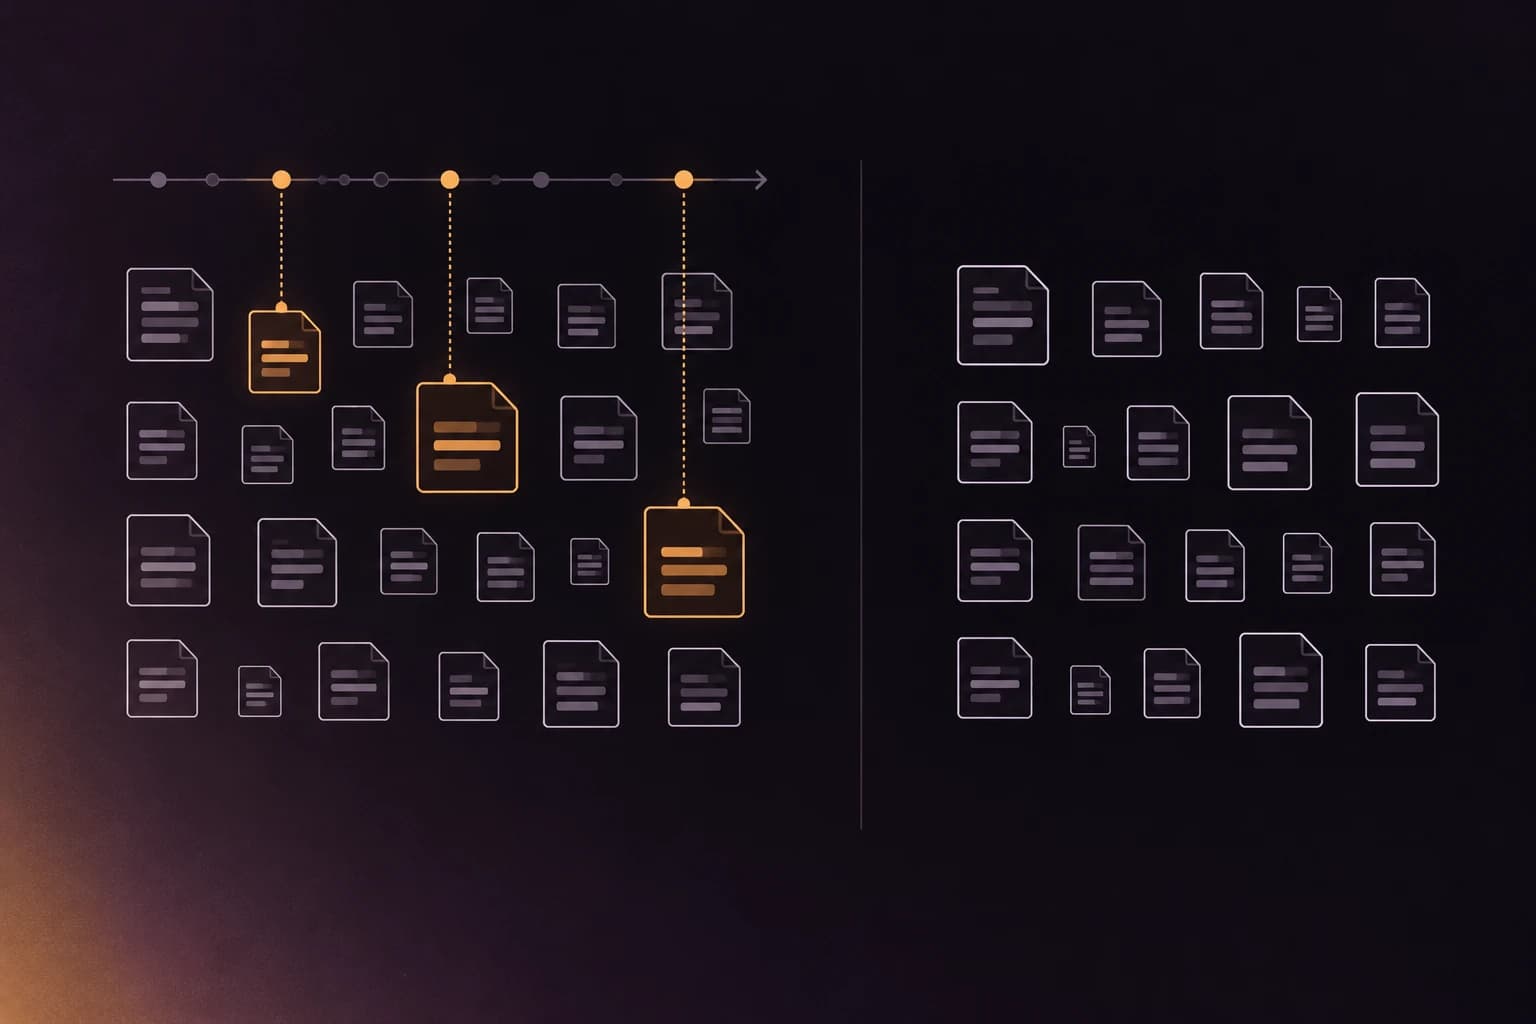
The second approach asks which files will hurt, so it reads version control as well as code. A complicated file nobody has touched in three years costs nothing today, while a complicated file that changes every week costs you on every change. CodeScene built its product on this idea, which it calls hotspots, and repowise uses the same family of signals.
SonarQube Server: debt ratio and maintainability rating
SonarQube Server defines technical debt as the summed remediation effort of its maintainability issues, and reports it as a ratio against the cost to write the code. Per its metrics documentation, the ratio is debt divided by the cost of one line (30 minutes by default) times the number of lines. The default rating runs A (0 to 5%), B (5 to 10%), C (10 to 20%), D (20 to 50%) and E (50% and above), and both the line cost and the grid are configurable.
It shines on breadth: a large rule set, quality gates in CI, and a clean split between overall code and new code, so a team can hold the line on new changes without fixing ten years of history first.
SonarSource does not present the ratio as a bug forecast, but independent researchers have tested the link. A 2020 SANER paper on 21 Java projects found that among 202 SonarQube Java rules, only 25 had relatively low fault-proneness, and that violations labelled as bugs were generally not fault-prone. A second study by the same group, on 33 Apache projects, found no difference in fault-proneness between classes with and without technical debt items. Both used older rule sets, so treat them as a reason to check on your own repository. They are not a verdict on today's product. For alternatives to the rule-based tools, see SonarQube alternatives.
Pick it if you want debt ratios, quality gates and a new-code policy across many repositories.
CodeScene: code health and hotspots
CodeScene scores code from 1 to 10 using 25+ factors, then weights it by where development actually happens. Its Code Health documentation describes an aggregate of 25+ factors scanned from the source, and two KPIs: average Code Health and hotspot Code Health, the weighted average over the files that change most.
It has the strongest published evidence of the commercial tools here. The Code Red paper by Adam Tornhill and Markus Borg (TechDebt 2022) analysed 39 proprietary production codebases and 30,737 files, and found 15 times more defects in low-quality code than in high-quality code, 124% more development time to resolve issues in it, and maximum cycle times 9 times longer. The data is proprietary, so you cannot rerun it, but it is peer-reviewed. More in repowise vs CodeScene and CodeScene pricing.
Pick it if you want a mature commercial product with peer-reviewed proprietary evidence.
Qlty, formerly Code Climate Quality
If you are searching for Code Climate alternatives, start with Qlty: Code Climate Quality is now Qlty. In November 2024 Code Climate announced that its Quality product had been spun out into a new company, Qlty Software, with Code Climate focusing on its engineering-intelligence product, Velocity. Qlty's migration guide says the Code Climate API was disabled on July 18, 2025, and that paid Quality accounts get a migration timeline from Qlty.
Qlty measures maintainability through code smells in two categories, duplication and structure, each with an estimated fix effort in minutes. It uses cognitive complexity by default and reports cyclomatic complexity too. Technical debt is the sum of that effort, and the debt ratio divides it by a Basic COCOMO estimate of the effort to write the code from scratch, mapped to grades from A (under 5%) to F. It sits in the same family as SonarQube and has a CLI (qlty smells).
Pick it if you used Code Climate Quality and want the same debt-ratio model from its successor.
Codacy
Codacy puts four metrics behind one A to F grade. Per its docs, it reports issues (in categories such as code style, error prone, complexity, performance, security and documentation), cyclomatic complexity, duplication and coverage, and the grade is a weighted average of the four with thresholds you configure. The strength is one grade and one pull request check covering all of it.
Pick it if you want issues, complexity, duplication and coverage summarised in a single grade per pull request.
NDepend
NDepend is the .NET option, with the most detailed cost model on this list. Per its technical debt documentation, every issue carries a debt (estimated man-time to fix) and an annual interest (man-time lost per year if left unfixed). Debt divided by interest gives a breaking point: the horizon after which fixing costs less than living with the issue. The debt ratio and SQALE rating use the same A to E bands as SonarQube.
Pick it if you are a .NET shop and want to rank fixes by payback time.
repowise
repowise scores every source file from 1 to 10 from 25 deterministic defect markers, with no model in the loop, so the same code and history always give the same score. Some markers read structure, such as nesting and function size, and others read git history, such as churn, author count and change entropy. The score has three separate signals (defect risk, maintainability, performance risk) that are never blended, so a performance finding does not move the defect number. See code health for the bands and the Fix first list.
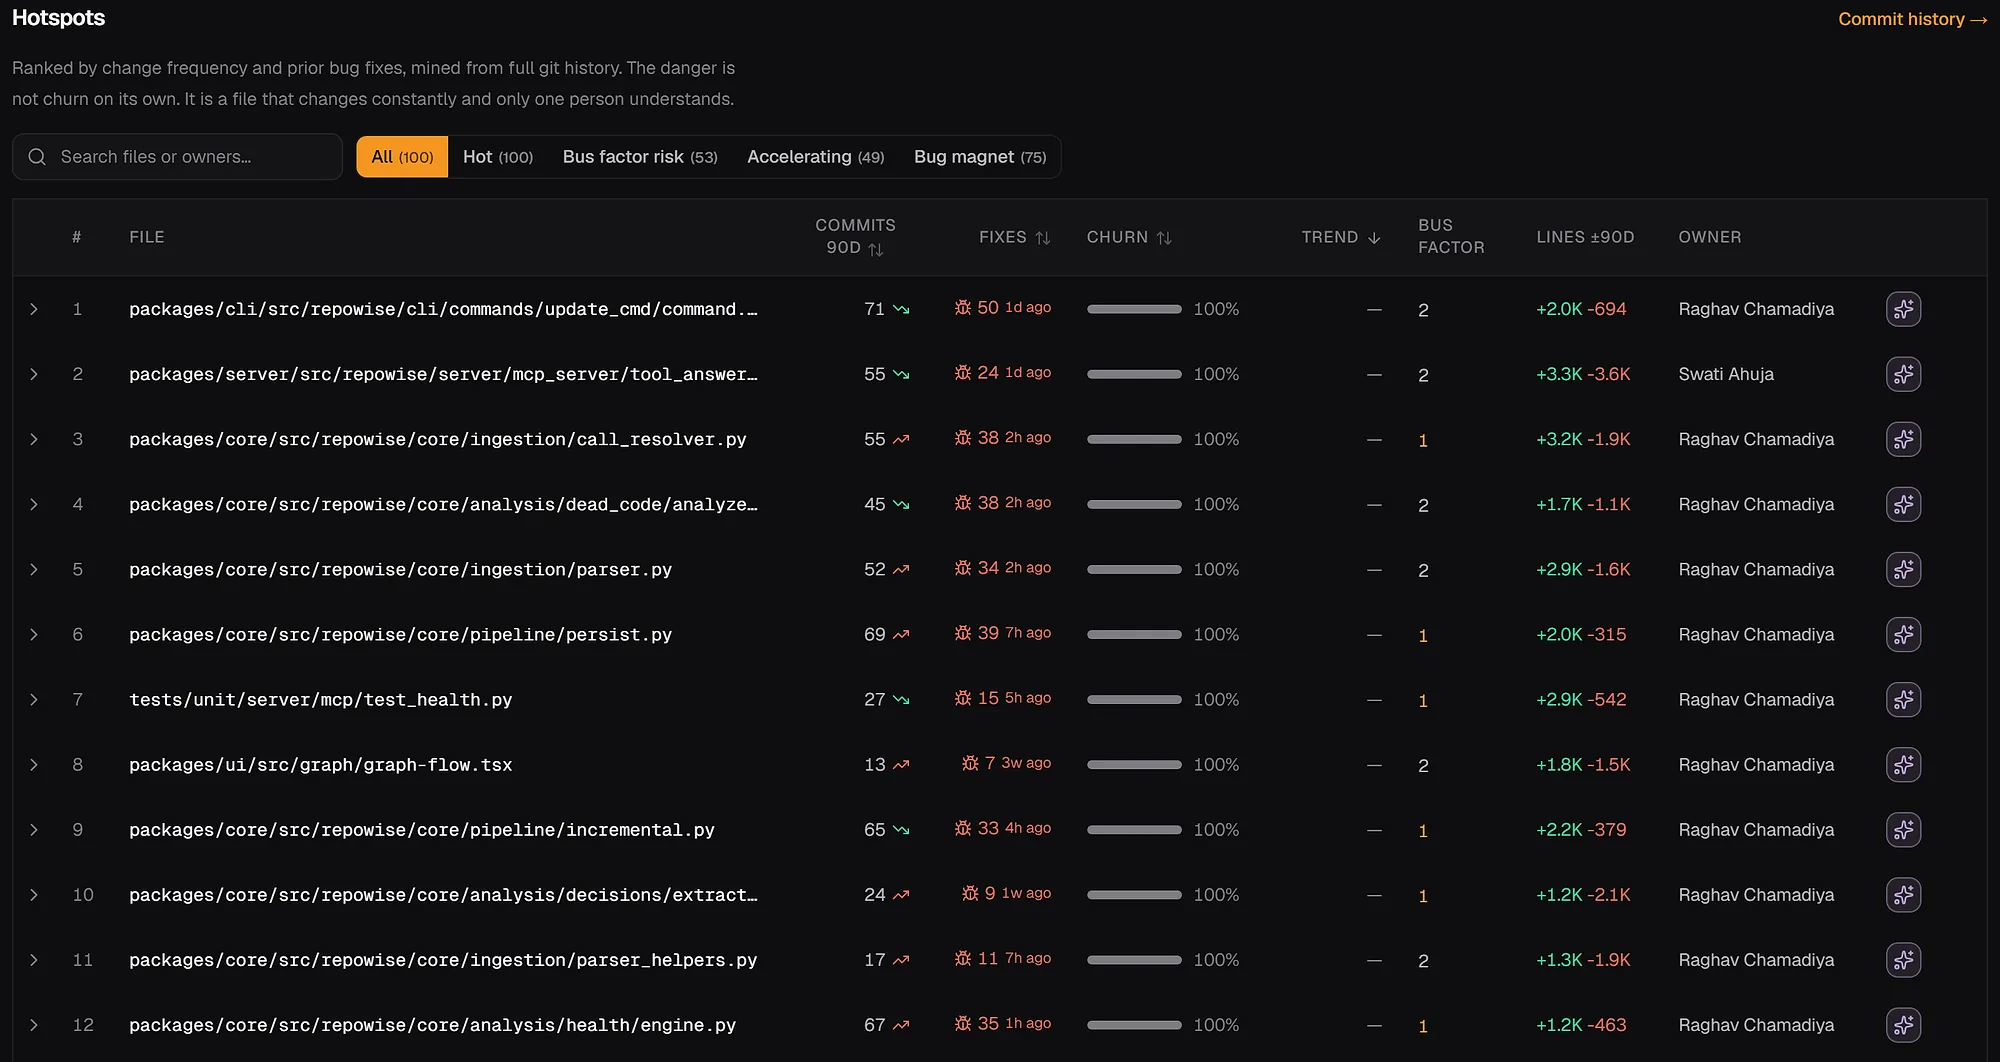
Alongside the score, repowise shows the history that explains it. The hotspots view ranks files by change frequency, prior bug fixes, bus factor and owner, from full git history.
repowise is open source under AGPL-3.0, runs locally with repowise init, and needs no API key for the scoring.
pip install repowise
repowise init      # indexes and scores every file
repowise health    # Fix first, KPIs, lowest-scoring files
Pick it if you want an open, deterministic score you can verify against your own history.
Does a technical debt score predict bugs?
Two tools here publish evidence: CodeScene (Code Red, above) and repowise. For repowise we ran an open, reproducible study, written up in Does code health predict bugs?. Across 21 open-source repositories and 9 languages (n = 2,826 · 21 repositories, 9 languages, 2,826 files · 2026-08), ranking files by health score reached a cross-project mean ROC AUC of 0.74 (95% CI 0.68 to 0.79) at predicting which files got a bug fix in the following six months. ROC AUC is the chance that a random buggy file scores worse than a random clean one: 0.5 is a coin flip and 1.0 is perfect. Scores were taken at a past commit, so no later fix could leak into them.
What the study found, and how to read it:
- Ahead of recent churn. The score beats ranking by recent churn by +0.10 AUC (n = 2,826 · p = <1e-9 · 21 repositories, 9 languages, 2,826 files · 2026-08).
- Head to head with CodeScene. On the same 2,770 files, scored at the same commit against the same labels, repowise surfaced 2.3x the defects under a fixed 20%-of-lines review budget, and reached an effort-aware (Popt) score of 0.607.
- Size, honestly measured. On raw AUC the score ties a plain line-count baseline, 0.737 against 0.742, because big files carry more bugs and AUC rewards that. Accounting for reading effort (Popt), it beats line count by +0.134.
- Where the signal is weaker. Within the smallest size bands most of the signal fades, because a tidy 40-line file gives the markers little to fire on. Per-repo AUC ranged from 0.55 to 0.86, so quote the cross-project mean rather than any one repo.
- Triage ordering. "Re-inspect what broke before" scores 0.609 on Popt against 0.524 for the health score. The score's job is to add discrimination and a structural reason for each file, which a rap sheet cannot give.
A simpler check runs on the repos we index. Across 899 public repos with enough fix history, the 20 lowest-scored files had a bug fix in the previous 180 days at a median of 3.56 times the base rate; pooled, 63% of flagged files had one against a 19% base rate (production index, 2026-10-06). That is a look-back, not a forecast. Method and the leak-free variant are in health flags vs bug fixes.
Which technical debt tool should you use?
Pick by the question you need answered.
- "How much cleanup is there, and is new code adding to it?" Use SonarQube Server, Qlty or Codacy. Debt ratios and quality gates are built for this.
- "Which fixes pay for themselves first?" Use NDepend's interest and breaking-point model, if you are on .NET.
- "Where will the next bug or slowdown come from?" Use a tool that reads history. Choose CodeScene for a mature commercial product with peer-reviewed proprietary evidence. Choose repowise if you want the scoring open, deterministic and the study reproducible on your own repo.
- "Both." A debt ratio gate on new code plus a history-aware score for prioritising existing code covers both questions.
Whatever you pick, turn the score into a short ranked list. How to prioritize technical debt covers ranking by impact per effort, and the best code health tools in 2026 covers more tools in this space.
Try it on your own repository
Run repowise init on a repo you know, then compare the lowest-scored files and the hotspots list with the files your team already dreads. Or paste a public GitHub URL on the repowise homepage to see the same view without installing anything. The benchmarks page lists every published measurement and how to reproduce it.
How we measured
Descriptions of third-party tools come from each vendor's own documentation or announcement, read on 2026-10-12 (SonarQube Server, CodeScene and NDepend docs fetched directly; Qlty and Codacy from their documentation and migration notes); the academic results come from the papers' published abstracts. We did not run SonarQube, Qlty, Codacy or NDepend on a shared corpus, so the table compares how each tool defines its score and says nothing about accuracy. The repowise study figures come from our published 21-repo study (measured August 2026). The 899-repo figures come from our production index on 2026-10-06, as a 180-day look-back on each repo's own history. I build repowise, so check the method and reproduce it on your own repository.
FAQ
- What is the best tool to measure technical debt?
- It depends on what you mean by debt. For a cleanup cost estimate with CI gates, SonarQube Server and Qlty are standard choices, and NDepend has the most detailed cost model for .NET. For finding the files most likely to cause bugs, tools that combine code analysis with git history, such as CodeScene and repowise, publish evidence behind their scores.
- What happened to Code Climate Quality?
- Code Climate spun its Quality product out into a new company, Qlty Software, announced in November 2024, and Code Climate now focuses on its Velocity engineering-intelligence product. The Code Climate API was disabled on July 18, 2025, and paid Quality accounts receive a migration timeline to Qlty.
- What is the SonarQube technical debt ratio?
- It is the estimated time to fix all maintainability issues divided by the estimated time to write the code, where each line defaults to 30 minutes. The maintainability rating converts the ratio to a letter: A for 5% or less, then B, C and D, and E for 50% or more. You can change both the cost per line and the rating grid.
- Are automated codebase health scores reliable?
- They are consistent, since most are deterministic. Debt ratios reliably measure rule violations against size. Health scores that read git history have shown a measurable link to future bug fixes, such as ROC AUC 0.74 across 21 repos in our study, though they rank where to look and do not prove any single file is broken. Check any score against your own bug-fix history before relying on it.
- What are good Codacy alternatives for technical debt?
- For the same kind of grade and pull request checks, SonarQube Server and Qlty are the closest matches. If you want the score to reflect how often code changes and who owns it, look at CodeScene or repowise. For .NET-only teams, NDepend adds a debt-and-interest cost model. Our Codacy alternatives post compares the replacements on price, hosting and security scanning as well.