On this page
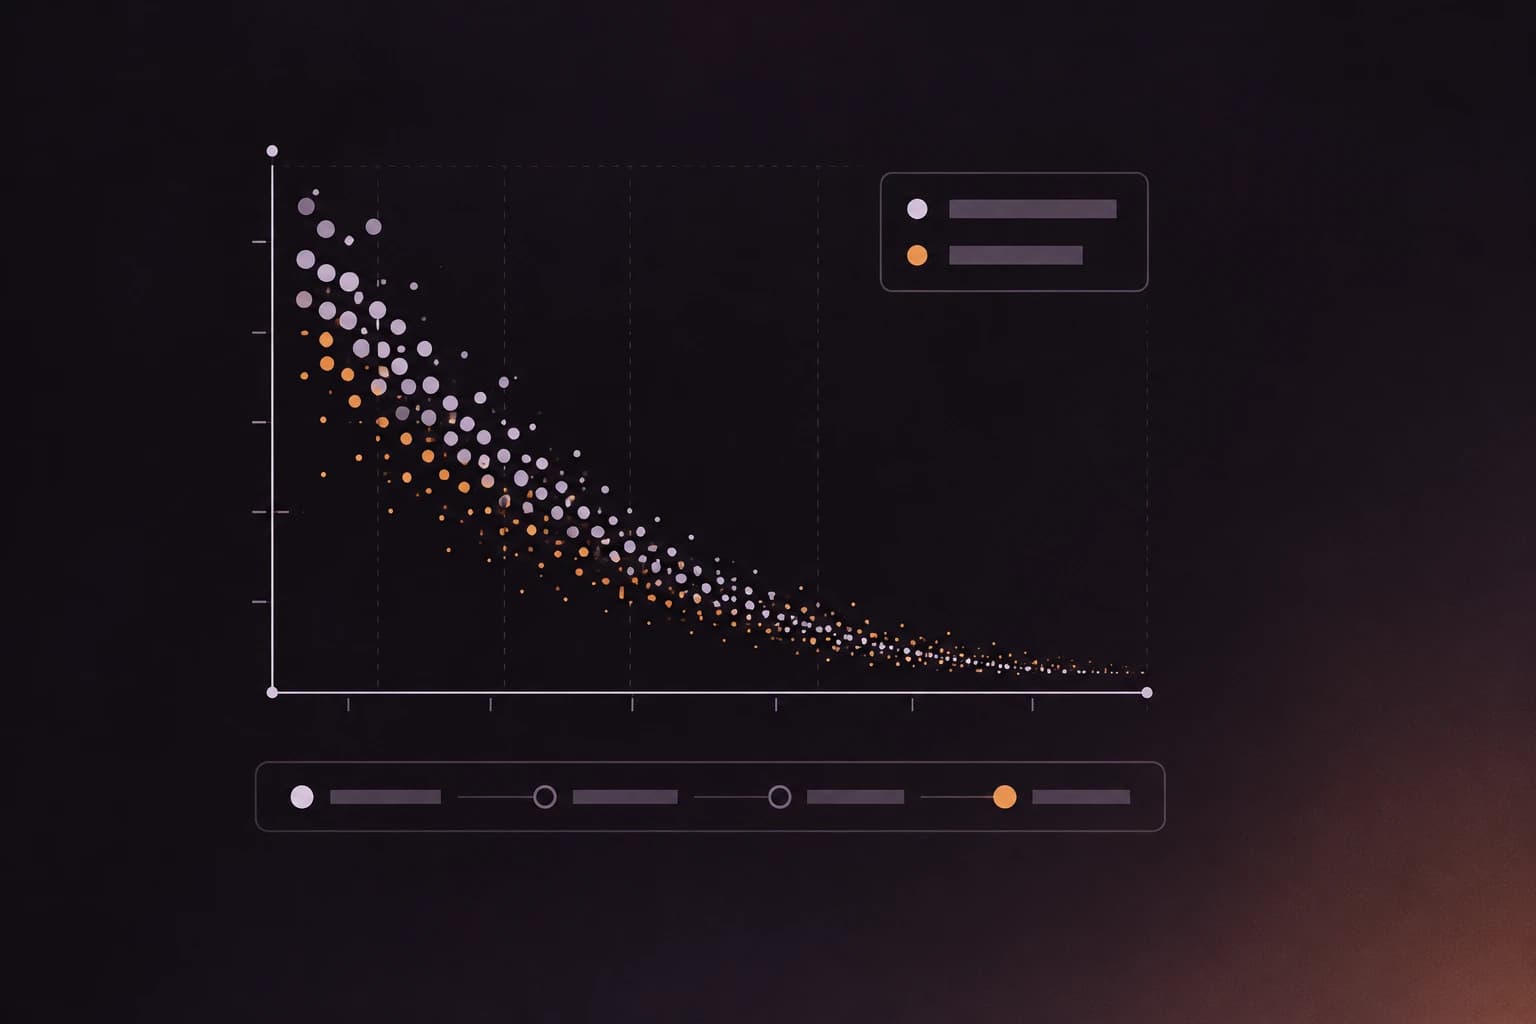
Do more GitHub stars mean better code quality? In our data, no: the more stars a repo has, the lower its code health score, and almost all of that is size. Across 3,126 public repos we scored, the median falls from 8.50 for repos under 100 stars to 6.80 for repos with 10,000 or more. Compare repos of the same size and the stars barely matter.
The whole post depends on one definition. repowise's code health score (1 to 10) rates how likely a file is to cause bugs and how hard it is to change, using static checks plus git history; the repo score is the average across files, weighted by lines of code.
Stars and health
Every public repo in our index with a health score on its latest index, grouped by GitHub stars:
| Stars | Repos | Median health | Median size (lines of code) |
|---|---|---|---|
| under 100 | 2,867 | 8.50 | 3,953 |
| 100 to 999 | 93 | 7.77 | 30,956 |
| 1,000 to 9,999 | 74 | 7.37 | 76,738 |
| 10,000+ | 92 | 6.80 | 146,497 |
Scroll the table sideways to see every column.
The last column shows the main reason: the median 10k-star repo is 37 times the size of the median repo under 100 stars.
Size and health
The same repos, grouped by size instead:
| Lines of code | Repos | Median health |
|---|---|---|
| under 1,000 | 970 | 9.91 |
| 1,000 to 9,999 | 919 | 8.30 |
| 10,000 to 99,999 | 829 | 7.24 |
| 100,000 to 999,999 | 366 | 6.79 |
| 1,000,000+ | 42 | 7.23 |
Scroll the table sideways to see every column.
Health drops fast as a codebase grows from a few files to tens of thousands of lines. Past 100,000 lines the drop stops in this table: the 42 repos with more than a million lines have a median of 7.23, a little above the 100,000 to 999,999 group.
Under 1,000 lines the median is close to a perfect 10 (9.91), because there isn't enough code yet for most problems to exist: no long functions, no tangled modules, no files that ten people keep editing. 479 of the 3,126 repos score exactly 10.00, and 450 of those are under 1,000 lines.
Same size, different stars
Now hold size roughly fixed and look at stars again:
| Stars | under 10k lines | 10k to 100k lines | 100k+ lines |
|---|---|---|---|
| under 100 | 9.35 | 7.24 | 6.83 |
| 100 to 999 | 8.60 | 7.31 | 7.17 |
| 1,000 to 9,999 | 7.07 | 7.43 | 7.14 |
| 10,000+ | 8.34 | 7.02 | 6.73 |
Scroll the table sideways to see every column.
Read across a row and health falls with size. Read down a column and it mostly doesn't move. In the 10k to 100k column the medians run 7.24, 7.31, 7.43 and 7.02, which is the same band, give or take. In the 100k+ column, the 10k+ star repos (6.73) sit close to the repos under 100 stars (6.83) and a little below the two groups in between. The first column jumps around because some of its groups are tiny: only 8 repos with 10,000+ stars have fewer than 10,000 lines.
Popular projects score lower mostly because popular projects are big, and big projects score lower, with most of the drop coming before 100,000 lines.
Why size drags the score down
The score is built from things that grow with a codebase:
- More code means more functions, so more chances that one is 500 lines long or nested six levels deep.
- More people means more hands on each file. Files that many people change often, for different reasons, are where bugs cluster, and popular projects have more of them. For bus factor across popular projects, see the bus factor of 35 popular open-source repos.
- More history means more change. The git-history part of the score looks at how often a file changes and how often those changes are fixes. Ten years of active development leaves marks that a two-month-old project has not had time to collect.
Why the drop slows past 100,000 lines is still open. Our working guess: by then every project already has its share of big, busy files, and extra code mostly adds ordinary files around them.
Big and healthy
Size does not decide the score on its own. Some big repos score above the median for their size. Two examples, both indexed in October 2026:
- fastapi/fastapi: 8.4 at 101,000 lines.
- dust-tt/dust: 7.5 at 1.8 million lines.
The repo pages show which files pull each score up or down, which is more useful than the number itself.
The scoring engine change
Our scoring engine changed on 13 September 2026. Since then it scores code files only, where it used to also count JSON, YAML and Markdown files, which always scored 10 and pushed big repos up. On 6 October we re-scored every older index the same way, so every number in this post counts code files only. The 321 repos that contain no code at all, mostly lists of links, lost their score in that re-scoring, which is why the sample is 3,126.
Repos indexed since 13 September still score lower than older indexes of the same size: 6.85 against 7.32 for 10,000 to 99,999 lines, and 6.58 against 6.88 for 100,000 to 999,999. I don't know how much of that gap comes from other engine changes and how much from which repos happened to be indexed recently, so I checked the pattern inside each group separately. Both groups show it:
| Stars | Indexed before 13 Sep (2,714 repos) | Indexed since 13 Sep (412 repos) |
|---|---|---|
| under 100 | 8.60 | 7.61 |
| 100 to 999 | 7.88 | 7.35 |
| 1,000 to 9,999 | 7.37 | 7.18 |
| 10,000+ | 6.96 | 6.67 |
Scroll the table sideways to see every column.
By size, the newer group goes 10.00 under 1,000 lines, then 7.80, 6.85, 6.58 and 6.48 for 1M+ (only 8 repos), so its fall slows after 100,000 lines without stopping. If you compare your repo with someone else's, check that both were indexed in the same period.
What this data shows and what it does not
- It is a correlation. Stars do not make code worse, and nothing here shows that worse code earns stars.
- The index is not a random sample. Most under-100-star repos are small personal projects people asked us to index; the popular ones are well-known open source.
- Use the score for comparison within a repo. A 7 on a mature, heavily used project can be a good place to work. The score is most useful for tracking one repo over time or ranking files inside it. For whether the score predicts bugs, see our validation study and health flags vs bug fixes.
To see where your own repo sits, paste any GitHub URL, or run repowise health locally. The code health guide covers reading the result.
How we measured
The sample is every public repo in our index whose latest index has a health score: 3,126 repos, checked on 6 October 2026 after the code-only re-scoring. Stars come from GitHub when the repo was last indexed. Size is lines of code (non-blank, non-comment) from the same index. Each file gets a health score from a set of checks on its syntax tree plus its git history, and the repo score is the line-weighted average. The engine is open source, and this post explains how the scorer works.
FAQ
- Do GitHub stars correlate with code quality?
- Weakly and negatively in our sample: median code health is 8.50 under 100 stars and 6.80 at 10,000+. Controlling for size removes most of the gap, so stars are tracking codebase size, not code quality.
- Why do popular repos score lower on code health?
- They are larger (the median 10k-star repo is about 37 times the size of the median repo under 100 stars) and have more contributors and more history. Each of those adds long functions, busy files and fix-heavy change patterns that the score penalizes.
- Does code health keep falling as a codebase grows?
- Mostly it falls until about 100,000 lines. In this sample the 42 repos above one million lines have a median of 7.23, slightly above the 100,000 to 999,999 group.
- Is a code health score of 7 bad?
- No. A 7 on a large, actively maintained project is common and often a perfectly workable place to code. Compare a repo against itself over time, or against repos of similar size.
- How is the code health score calculated?
- Each file starts at 10, static checks on its syntax tree and git history deduct points, and the repo score is the line-weighted average. It needs no LLM key. See the scorer internals.