repowise parses your repo with tree-sitter ASTs across 15 languages into one directed graph of imports, calls, inheritance, and co-changes, then ranks it with PageRank and betweenness and derives a C4 view straight from the result. The graph is exported and human-browsable, scales to 30K+ nodes, and renders deterministically with no LLM in the layout path, so the same code always produces the same diagram. Every node links to its wiki page, code health, and git risk.
A code dependency graph is a directed graph of a codebase where nodes are files and symbols and edges are their relationships: imports, calls, inheritance, and co-change. repowise builds one from tree-sitter ASTs, ranks it with centrality, and derives C4 architecture views from it, so you read how a system actually fits together instead of trusting a hand-drawn diagram.
Why does a dependency graph matter?
Every non-trivial change ripples through code you didn't open. Without a graph, that ripple is invisible until something breaks in production.
A diagram on a whiteboard or in a stale Lucidchart describes the system someone remembers, not the one that ships. The gap between the two is where regressions live, and it widens every commit nobody redraws.
- You cannot estimate blast radius from a diagram that doesn't match the code.
- Onboarding stalls when the only map of the system lives in one senior engineer's head.
- AI agents hallucinate structure when they have no grounded graph to reason over.
How does the dependency graph work?
repowise treats architecture as a derived artifact, not a drawing. The pipeline is deterministic end to end: only the parse and the math, no model in the layout path.
1. Parse. Tree-sitter ASTs produce a two-tier graph: one file node per source file (imports / imported-by) and one symbol node per function, class, and method (caller / callee). Both tiers live in a single directed graph, so you can traverse file→file, file→symbol, or symbol→symbol in one query.
2. Resolve edges. A three-tier call resolution pipeline links calls to definitions with confidence scoring: exact (unique import/namespace path, confidence 1.0), heuristic (name plus context, 0.7-0.95), and fallback (name-only, surfaced for review). Naive name-matching is wrong on real code often enough to mislead; the tiers buy precision over recall.
3. Add framework-aware edges. Dedicated resolvers add route-to-handler edges that static parsing alone never sees, connecting an HTTP route to the code that actually handles the request.
| Edge type | What it captures |
|---|---|
imports | File depends on another file's module surface |
calls | Symbol invokes another symbol (confidence-scored) |
inherits / implements | Class extends a base / satisfies an interface or trait |
co-changes | Files that historically change together (from git) |
4. Rank. PageRank gives global importance; betweenness centrality finds symbols on many critical paths; in/out degree gives direct dependents; strongly connected components flag circular imports; Leiden community detection recovers logical modules even when the directory tree doesn't. The view stays legible at scale because it ranks rather than dumping every node.
5. Derive views. Containers, components, and external systems are derived deterministically into C4 levels; the same graph feeds the Knowledge Graph, module decomposition, and execution-flow traces, all rebuilt incrementally on every commit.
repowise parses 15 languages to AST, at two depths of analysis.
| Tier | Languages | What the graph gets |
|---|---|---|
| Full | Python, TypeScript, JavaScript, Java, Kotlin, Go, Rust, C++, C# | Import resolution, call resolution, heritage extraction, framework-aware edges |
| Good | C, Ruby, Swift, Scala, PHP | Import resolution, call resolution, heritage, dedicated workspace-aware resolvers |
| Config / data | OpenAPI, Protobuf, GraphQL, Dockerfile, Terraform, and more | Parsed for external systems and containers |
How does the dependency graph help you?
One graph, several ways to read the system. Each view answers a different question without you redrawing anything.
Orientation: read an unfamiliar repo in minutes
The interactive graph and C4 levels let you start at the system boundary and drill to a single function, following real edges instead of guessing from folder names. Community detection labels the logical modules for you.
- Start at Level 1 system context, drill to containers, then components.
- Jump from any node into its wiki page, code health, and git risk.
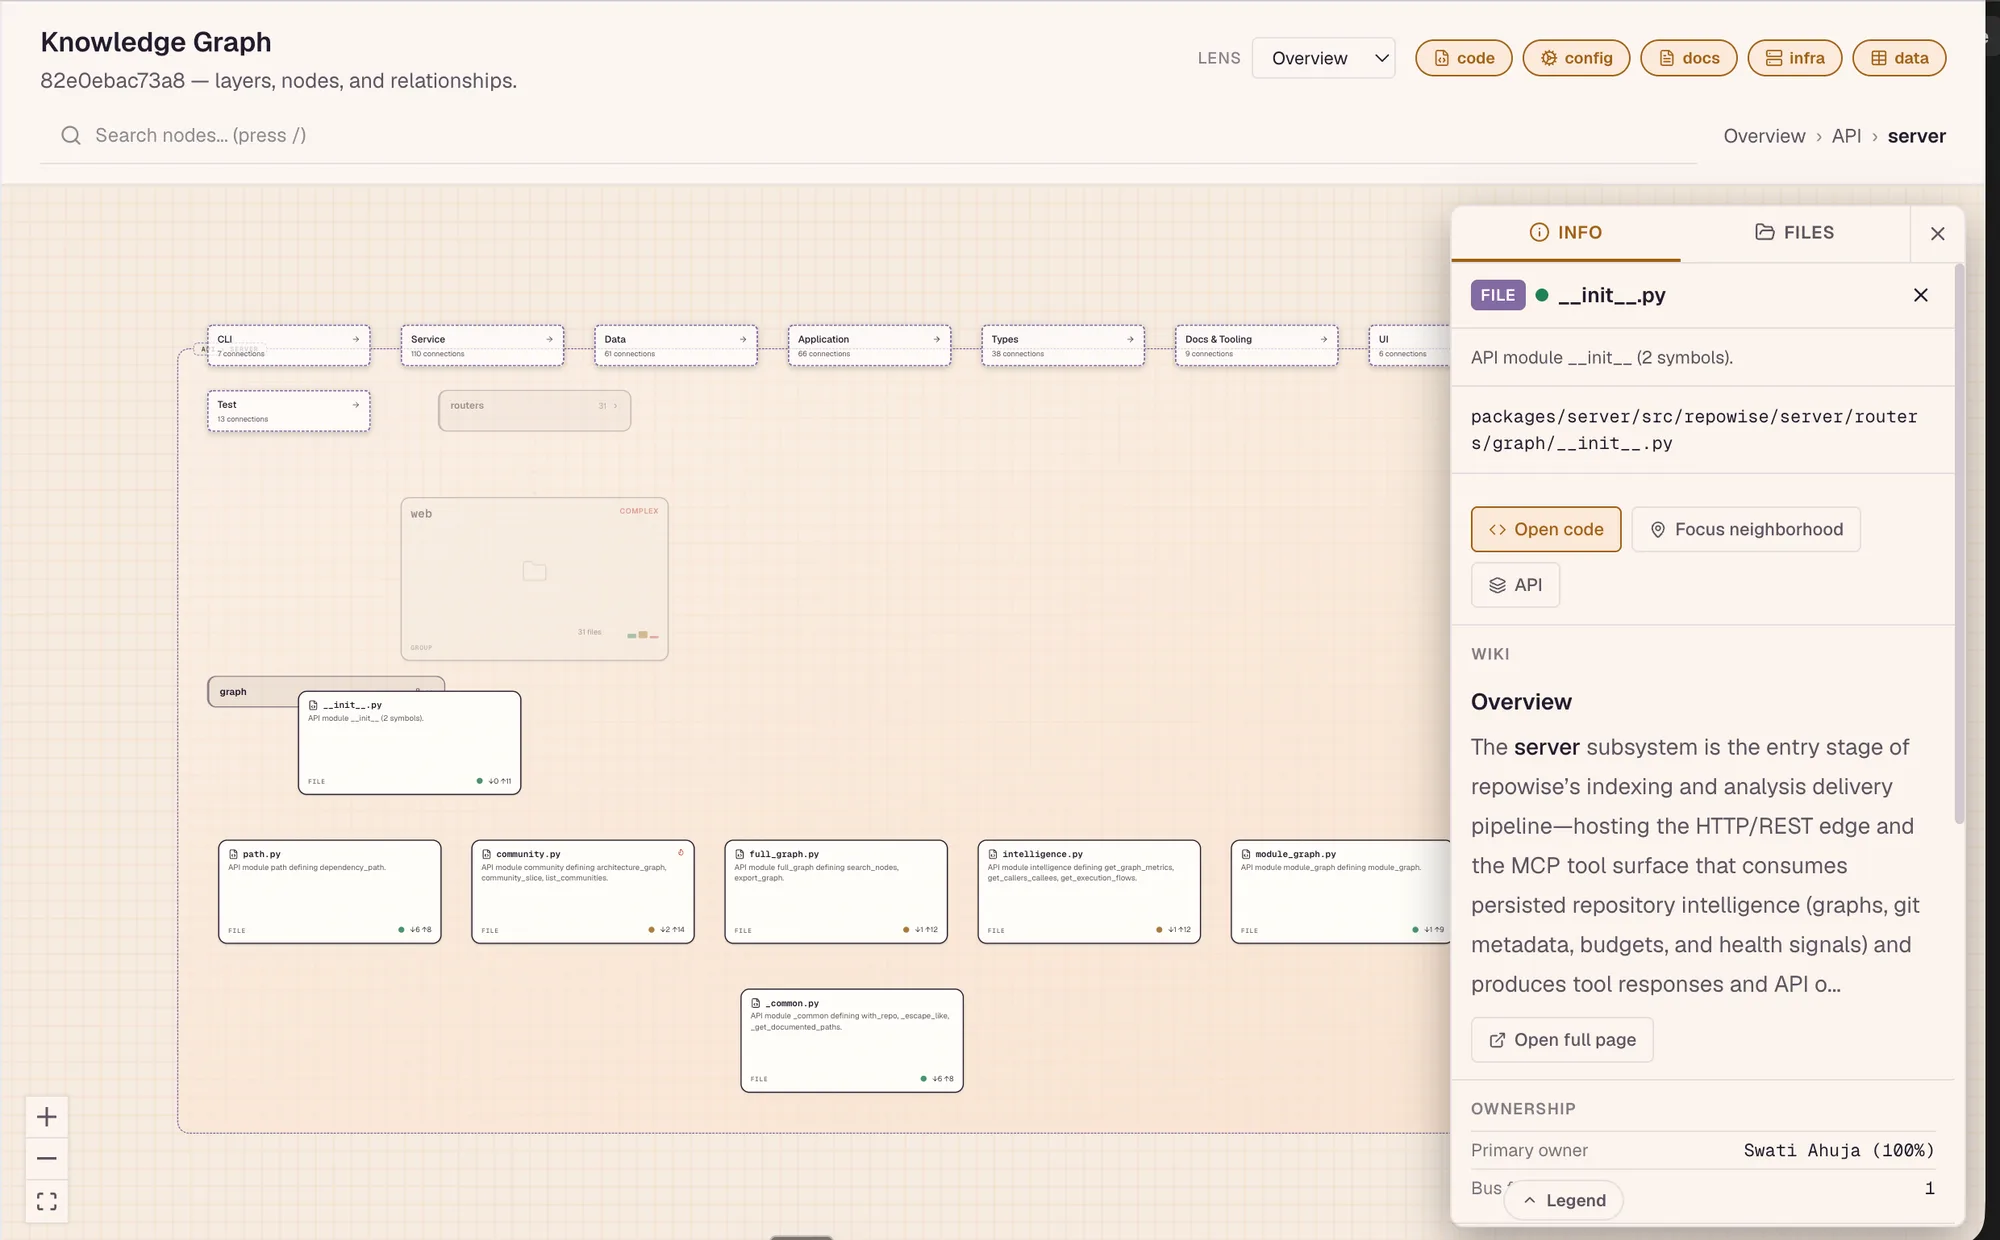
C4 model: system context to components, from the code
repowise derives three C4 levels straight from the graph: Level 1 system context, Level 2 containers (deployable parts from package info, with a top-directory fallback), and Level 3 components (sub-modules and their relations). Views are URL-synced behind ?view=c4, so you can share a link to an exact slice.

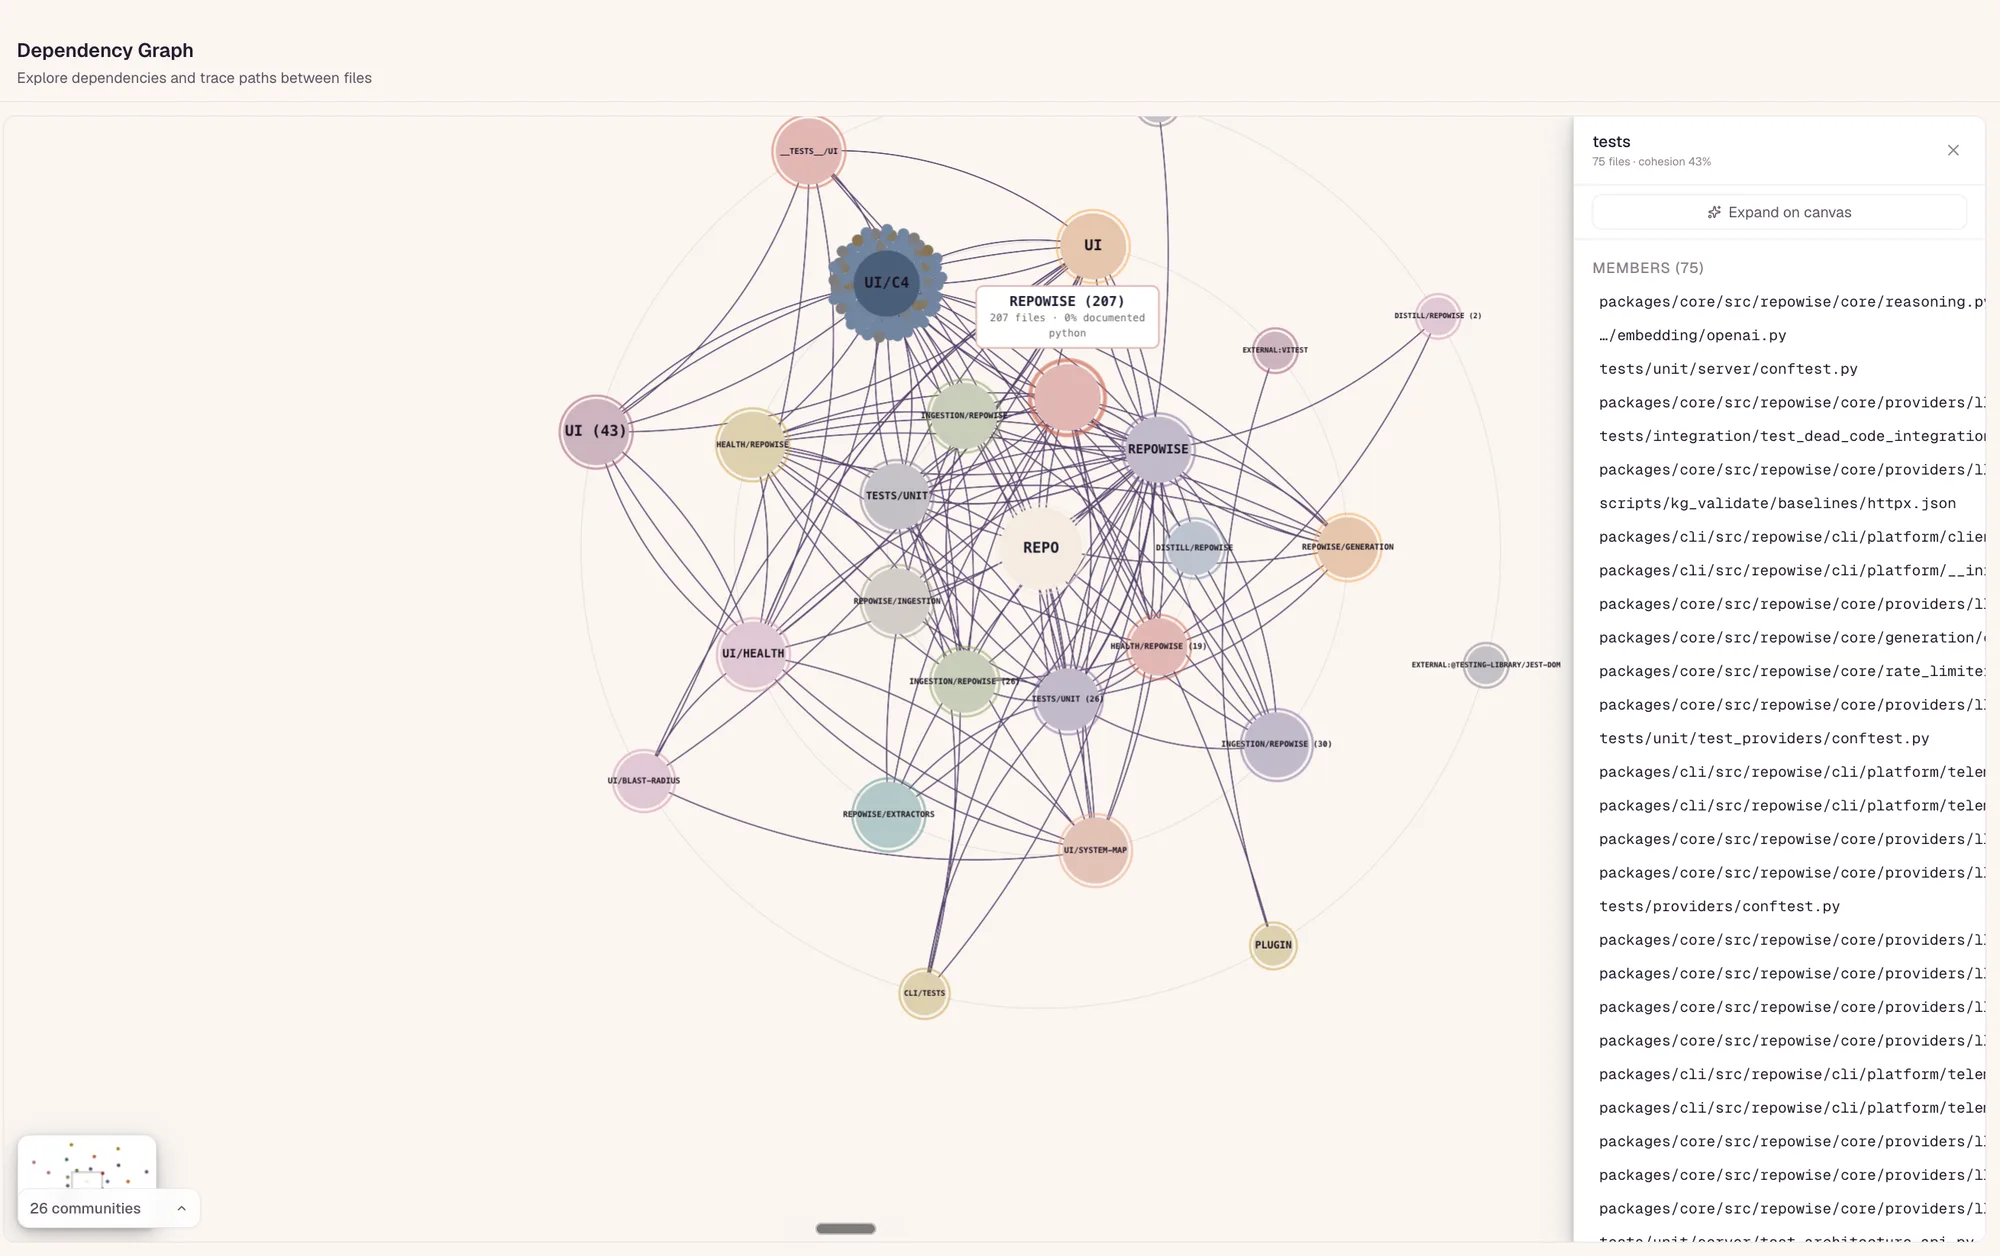
Knowledge Graph: the logical map, not the folder tree
The Knowledge Graph renders the layered architecture: communities, their cohesion, and the cross-cutting edges between them. It surfaces the structure your directory layout hides, with each module labeled from its most-common path segment.
Blast-radius input: see what a change touches
Because the graph is directed and typed, it is the substrate blast-radius and risk analysis walk. Co-change edges from git add the coupling that static imports miss, so the impact estimate reflects how the code really moves.
- Trace dependents along
importsandcallsedges before you edit. - Co-change edges flag files that break together even with no static link.
Onboarding and agent grounding: a map humans and LLMs both read
The same exported graph that orients a new hire grounds an AI agent over MCP. Instead of hallucinating structure, the agent reasons over verified nodes, edges, and centrality, and cites the wiki and decision records attached to them.
Execution flows: the paths that actually run
On top of static edges, repowise traces execution flow from each natural entry point and ranks what's reached, so you see the symbols most code paths run through rather than treating every node as equal.

Walkthrough: browse the architecture yourself
Open any live public repo and move through the views. Everything is shareable by URL.
Step 1 — Open the Architecture view. Land on the interactive dependency graph behind ?view=graph. Pan the ELK-laid-out graph; critical nodes are sized by PageRank.
Step 2 — Switch to C4. Toggle to ?view=c4 and step from system context to containers to components, sharing a link to any slice.
Step 3 — Open the Knowledge Graph. See the layered, community-detected architecture and the dependency edges between modules.
Step 4 — Open Modules. Read the module decomposition: each community with its cohesion score, files, and label.
Proof
Each figure stands alone and is reproducible on your own repo.
| Result | Value |
|---|---|
| Languages parsed to tree-sitter ASTs | 15 (9 full-tier with call resolution, 5 good-tier) |
| Nodes in the interactive graph | 30K+, ELK layout + React Flow, kept legible by centrality |
| Centrality ranking | PageRank + betweenness, materialized to a SQLite-backed store |
| Call resolution | Three-tier, confidence-scored (exact 1.0, heuristic 0.7-0.95, fallback) |
| LLM in the layout path | 0, the same code always renders the same diagram |
| License | AGPL-3.0, self-hostable on private code |
Try it on your repo
Open the Architecture, C4, and Knowledge Graph views on a live repo, or build them on your own code: every heuristic is open source and runs locally.
pip install repowise
repowise initHow each role uses this feature
Run the full graph and C4 views inside your firewall with no model in the layout path, so the architecture map reproduces byte-for-byte for audit. Multi-repo workspaces map the whole estate from one federated MCP endpoint.
A derived C4 view gives you architecture review without the redraw tax, and Leiden module cohesion scores make decomposition debt visible. You read the structure from the code that ships, not a stale diagram.