Process metrics beat structural metrics for predicting defects
The single strongest predictor of where bugs land is how many other files change whenever you touch this one. It ranked above every structural metric I tested. It ranked above file size. Complexity, nesting, god classes all came second.
It surprised me, because the reflex runs the other way. When you want to know which files in a codebase are risky, you measure their shape: cyclomatic complexity, nesting depth, function length, god classes, duplicated blocks, low cohesion. It's a reasonable instinct. That code is plainly harder to read, and harder-to-read code feels like it should be buggier. Most static-analysis tooling is built on exactly this premise.
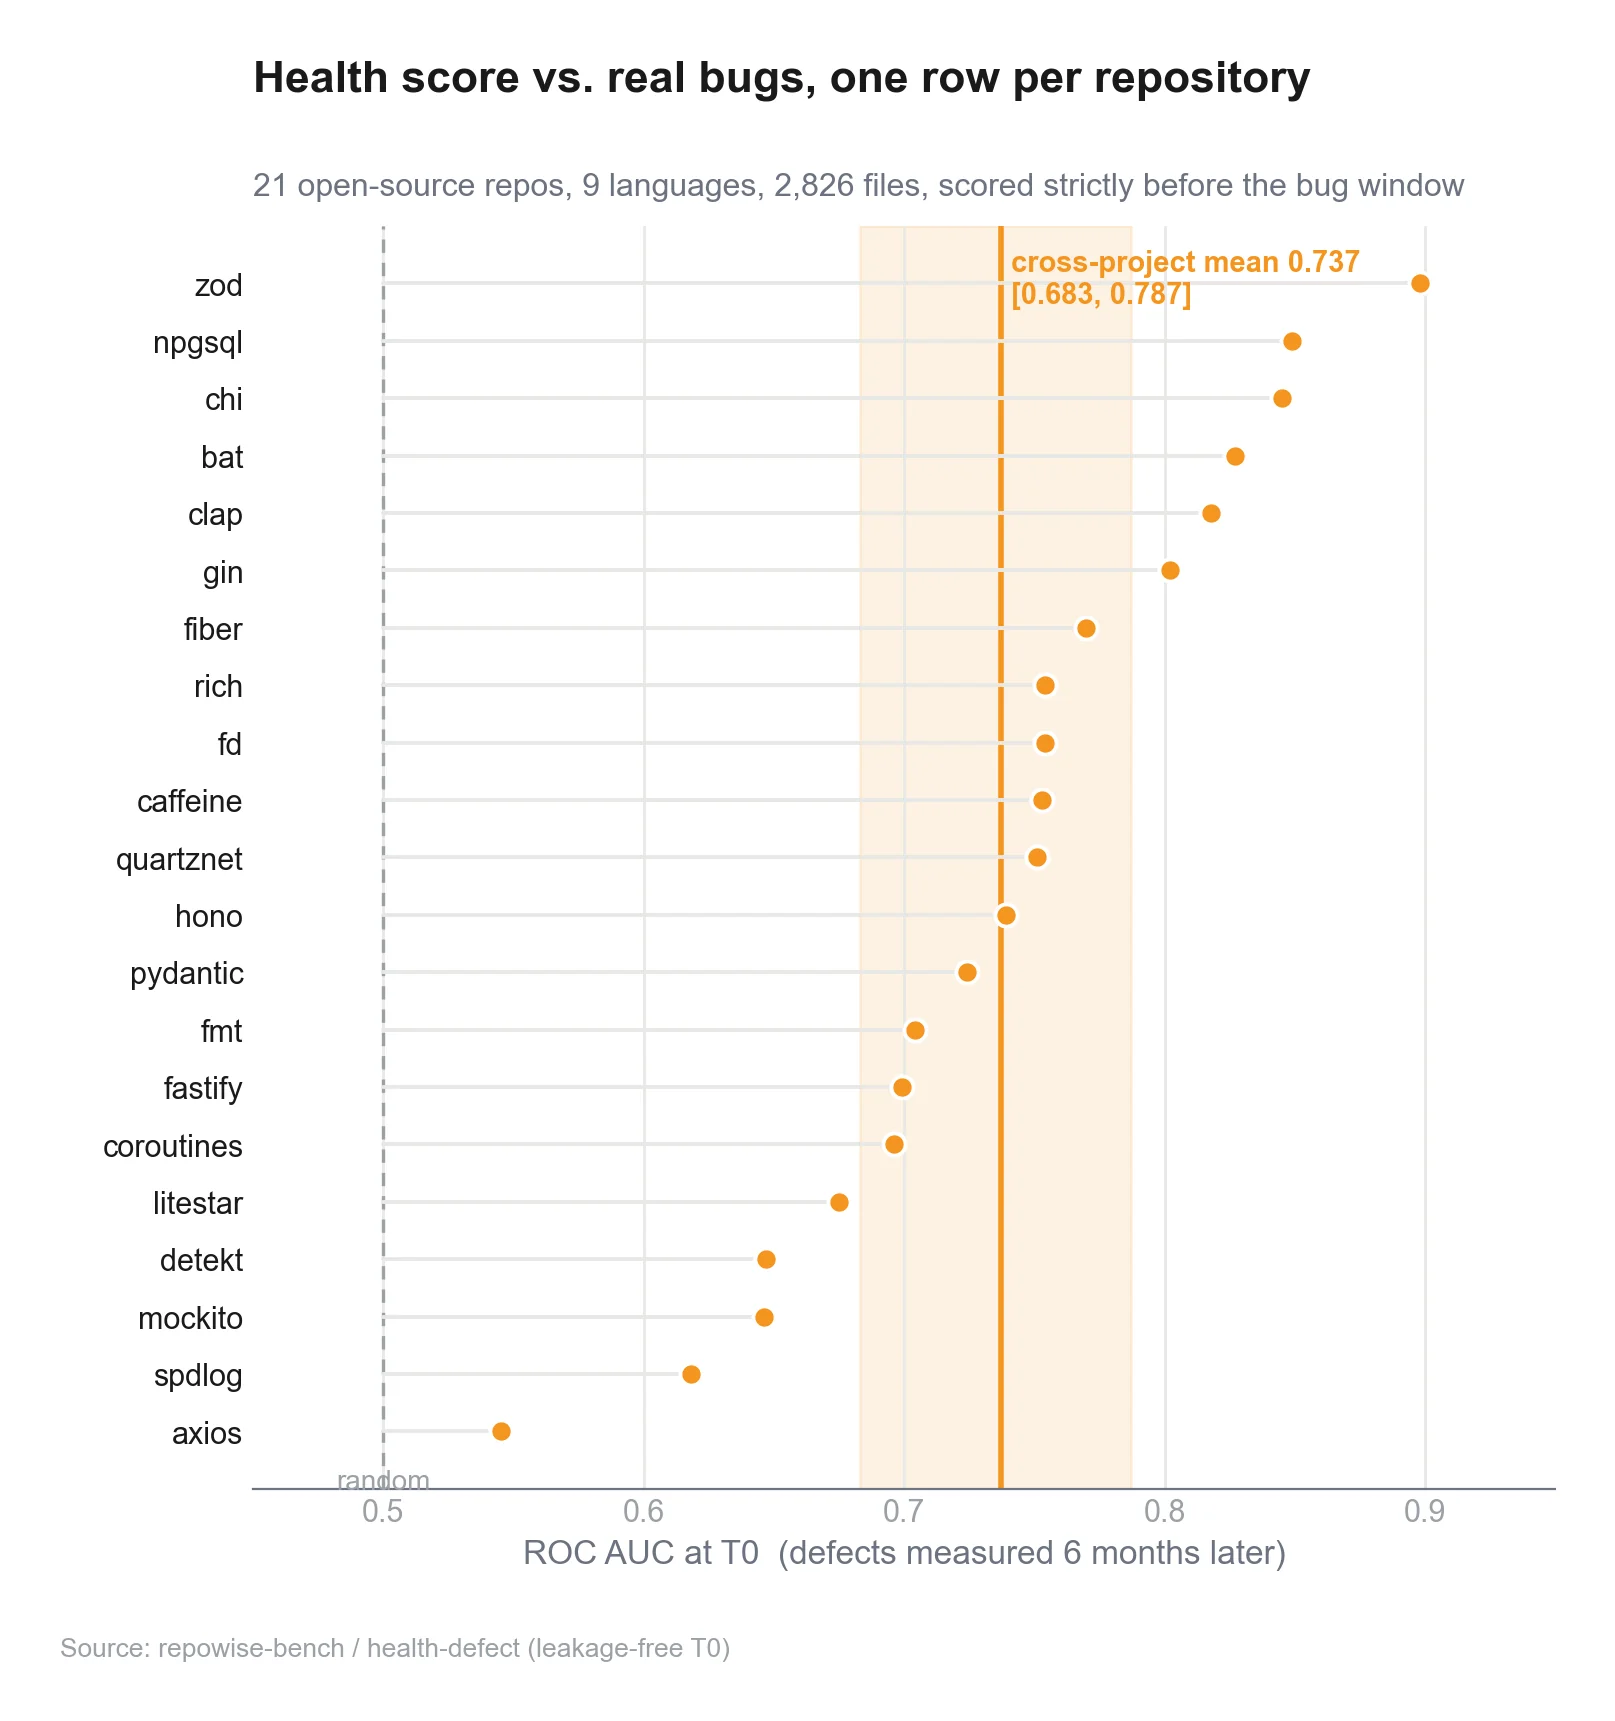
I spent the last few months building and validating a defect-prediction benchmark across 25 code-health markers and 21 open-source repos in nine languages, and the data kept saying the reflex is incomplete. The strongest predictors of where bugs actually land aren't structural. They are evolutionary: they describe how the code got to be the way it is, not what it looks like now. The research literature has known this for years, and it's still not how most teams or tools think, so here it is with fresh numbers. For the full picture, see the complete code-health guide.
Two families of signal
A code-health score is an aggregate, and it helps to split what goes into it into two families.
Structural markers read a single snapshot of the code. They need nothing but the file in front of you: an AST, a token stream, a symbol table. In my set these are the complexity metrics (cyclomatic, cognitive, nesting, "brain methods," "bumpy road" functions), the size-and-shape metrics (long methods, too many parameters, primitive obsession), god classes, low cohesion, and duplication, which comes to roughly ten of the twenty-five. If I hand you a tarball with the .git directory deleted, these are the only metrics that still work.
Process markers, also called evolutionary, read the repository's history instead of or alongside its current shape. They include churn, co-change scatter (shotgun-surgery coupling, which captures how widely a file's changes ripple into unrelated files), change entropy (Ahmed Hassan's measure of how chaotically a file's modifications are distributed over time), ownership dispersion (how many minor contributors poke at a file), knowledge loss (where the people who wrote a chunk of code have left), and prior defects. That is another ten or so, and none of them can be computed from a snapshot, since they are a property of the commit graph. The remaining handful are test-and-coverage signals, which are their own conversation.
The interesting question is which family carries the prediction. I expected it to be close, with structure slightly ahead, because structure is what most of us obsess over in code review. It wasn't close. The top three predictors were all evolutionary, and co-change scatter cleared the file-size baseline while the best structural marker fell short of it.
The literature already knew this
Before my own numbers, credit where it's due, because this has been measured before, repeatedly, and the field has been quietly telling us the answer for the better part of two decades.
Moser, Pedrycz and Succi put it most directly in their 2008 ICSE paper, A comparative analysis of the efficiency of change metrics and static code attributes for defect prediction. They pitted git-style change metrics against static complexity metrics on Eclipse and found the change metrics substantially more predictive. Five years later, Rahman and Devanbu published How, and Why, Process Metrics Are Better (ICSE 2013), where the title is the result, showing across many systems that process metrics both predict better and are more stable across releases, while code metrics are "stagnant," largely a proxy for size, and degrade out of the version they were tuned on. Nagappan and Ball's work on relative code churn at Microsoft, and Hassan's change-entropy model, point the same direction.
The recurring explanation is the one I find most convincing: static code metrics are heavily entangled with file size, and once you control for size they have surprisingly little left to say, whereas process metrics measure something size can't fake, namely where the team actually keeps struggling.
What our 25 markers say
The same result holds on a fresh, leakage-free corpus. The benchmark fits a regularized logistic model over the per-file marker hits with file size (NLOC) included as an explicit control, so every coefficient below reads as defect lift beyond size, meaning what the marker adds once you have already accounted for how big the file is.
 Standardized logistic coefficients per marker, controlled for file size
The top three predictors are all process metrics. Co-change scatter is the single strongest signal in the entire set, change entropy is second, and ownership risk is third. Only then do the structural metrics appear, with nested complexity, complex conditionals, and long methods, and they are real and useful, just second-tier. Meanwhile the classic structural smells that get the most airtime in code review, duplication and low cohesion, sit at or below zero once size is controlled. They barely register, and on the small files where they fire most, they are often idiomatic and harmless.
The dashed line is file size itself, at +0.35. Sitting above it is co-change scatter, a metric that knows nothing about your code's shape and everything about how its changes spread, out-predicting the lines-of-code baseline that's notoriously hard to beat. If you have only ever ranked technical risk by complexity, that chart should be mildly annoying, as it was for me.
Why would history beat shape?
The intuition I have landed on is that structure is the part of a file an author controls and grooms. A careful engineer keeps cyclomatic complexity down, splits long functions, and names things well, so complexity partly measures author diligence, and diligent authors write code in tidy-looking files, including the tidy-looking files that still have bugs, because the bug was in the problem, not the prose.
History measures something the author can't groom away. Co-change scatter catches the file that can't be touched without editing six others, a coupling that no amount of local cleanliness fixes. Change entropy catches the file that gets poked from every direction with no settled design. Ownership risk catches the file that ten people have each touched once and nobody understands. Those are the conditions under which humans introduce bugs, and they are invisible to anything that only looks at the current snapshot. A file can be beautifully factored and still sit at the unstable center of the system, and the git graph sees that while the AST doesn't.
The catch nobody puts on the slide
The part that complicates the clean "process wins" story is also the reason I trust the result more, not less.
Process metrics are the strongest predictors and the easiest to accidentally fake. Because they read a recent window of history, they leak future information catastrophically if you measure them carelessly. Score a file at HEAD and label it from the same recent window, and the bug-fix commits you are trying to predict are themselves churn, co-changes, and entropy, so the marker "detects" the very activity that defines the label, and you get a beautiful but completely fraudulent AUC.
I learned this concretely. One of the process markers, developer_congestion, which counts concurrent contributors in a recent window, looked like a strong predictor under naive HEAD scoring and shipped with a healthy weight. When I re-ran everything leakage-free, scoring each repo six months before its bugs landed, the signal collapsed. It was a phantom, since the "congestion" was the fix commits arriving, and its weight got cut to the floor. Change entropy, by contrast, survived the same test as a real predictor rather than an artifact. The only way to tell the two apart is to measure in the past. (I wrote up that whole leakage trap, and the benchmark it nearly sabotaged, in the companion post.)
So the honest version of the headline is that process metrics beat structural metrics if you measure them without leakage, and the discipline required to do that is exactly why they're so often reported wrong. Structural metrics, whatever their ceiling, can't lie to you this way, because a snapshot has no future to leak.
Don't throw out structure
That last point is the case for keeping structural metrics, and it's stronger than "they're a decent second tier."
Structural metrics degrade gracefully in every situation where process metrics simply don't exist:
- A fresh checkout or a shallow clone has no usable history, so the evolutionary half of the score goes dark and structure is all you have.
- A pre-merge PR diff is about code that, by definition, hasn't accumulated history yet, so you can't ask "how often did this churn" about a function written this morning.
- A vendored or generated file has a git history that is mostly noise.
To put a number on how much structure carries on its own, I ran the score on a dataset it had never seen, the PROMISE/Jureczko jEdit benchmark, as a single-release snapshot, which means zero git history and only the structural markers active.
 Structural-only score vs baselines on the jEdit snapshot benchmark
Structural-only, with no tuning to this dataset and the entire evolutionary half switched off, the score lands at AUC 0.76 and 0.78 across two releases, within striking distance of the dataset's own cross-validated full-metric model, and it beats raw line count on the effort-aware Popt metric on both. That is the floor of the score, and the floor is genuinely useful. Structure isn't the strongest signal, but it's the always-available one, and it's deterministic and language-portable, and it runs on code that has no history at all.
The two families have complementary failure modes. Process metrics are powerful where there's deep, clean history and useless (or dangerous) where there isn't, while structural metrics are modest but never absent. A score that leans on only one of them is fragile in a predictable direction.
The confound that sits over both
One caveat applies to everything above, and it's file size. It's the strongest single predictor in defect prediction, full stop, and both families are correlated with it. That is why every coefficient in this post is reported after controlling for size, and why I trust the effort-aware Popt metric (which charges an inspection budget in lines) more than raw AUC (which quietly rewards "just flag the big files"). Any claim that a metric "predicts defects" without controlling for size is, until proven otherwise, a claim that big files have more bugs, which we already knew.
What I'd take from this if I were building or buying a health score
- Weight evolutionary signals heavily where you have the history to support them, meaning co-change, change entropy, and ownership, because they are where the prediction actually lives.
- Measure them leakage-free or not at all, because a churn or co-change number computed at
HEADagainst a recent label window is worse than no number, in that it's a confident wrong one. If a tool can't tell you how it avoids this, be suspicious. - Keep structural metrics for the cold-start cases, including fresh clones, PR diffs, generated code, and brand-new files, because they are the graceful fallback, and on a snapshot they are all you've got.
- Control for size everywhere, and prefer effort-aware metrics when you are deciding what to actually review.
- Don't confuse "looks messy" with "is risky." Some of the most-cited smells, duplication and low cohesion, barely move the needle on defects once size is out of the picture. They are maintainability signals, which is a real and different thing, and treating them as bug predictors is how you end up refactoring tidy code while the actual risk sits in a clean-looking file at the center of the change graph.
None of this means complexity metrics are worthless, since readable code is a goal worth having on its own terms. It means that if your specific question is where the bugs are, the answer is written more clearly in the repository's history than in any single snapshot of its shape. What I don't have yet is controlled data on how far this holds across languages with very different commit cultures. I have a prior. I don't have the numbers.
If you want to see these markers computed on a real codebase, both families, with Repowise attributing exactly which signals fired, the live examples run the whole thing end to end, and the code-health docs break down how each marker is gated and weighted.